
Page 138 - Tandem Techniques
P. 138
Page 120
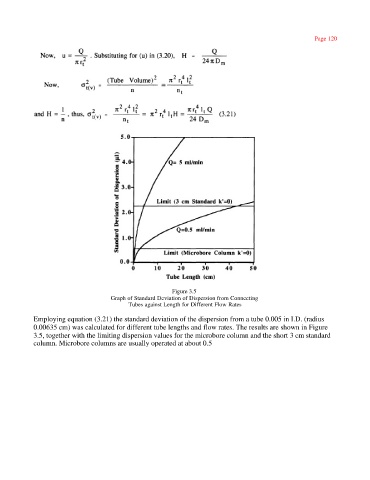
Figure 3.5
Graph of Standard Deviation of Dispersion from Connecting
Tubes against Length for Different Flow Rates
Employing equation (3.21) the standard deviation of the dispersion from a tube 0.005 in I.D. (radius
0.00635 cm) was calculated for different tube lengths and flow rates. The results are shown in Figure
3.5, together with the limiting dispersion values for the microbore column and the short 3 cm standard
column. Microbore columns are usually operated at about 0.5