
Page 177 - Tandem Techniques
P. 177
Page 160
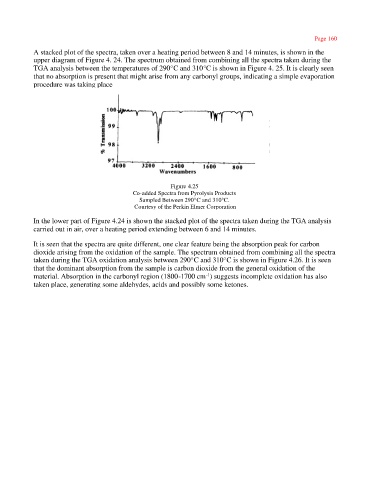
A stacked plot of the spectra, taken over a heating period between 8 and 14 minutes, is shown in the
upper diagram of Figure 4. 24. The spectrum obtained from combining all the spectra taken during the
TGA analysis between the temperatures of 290°C and 310°C is shown in Figure 4. 25. It is clearly seen
that no absorption is present that might arise from any carbonyl groups, indicating a simple evaporation
procedure was taking place
Figure 4.25
Co-added Spectra from Pyrolysis Products
Sampled Between 290°C and 310°C.
Courtesy of the Perkin Elmer Corporation
In the lower part of Figure 4.24 is shown the stacked plot of the spectra taken during the TGA analysis
carried out in air, over a heating period extending between 6 and 14 minutes.
It is seen that the spectra are quite different, one clear feature being the absorption peak for carbon
dioxide arising from the oxidation of the sample. The spectrum obtained from combining all the spectra
taken during the TGA oxidation analysis between 290°C and 310°C is shown in Figure 4.26. It is seen
that the dominant absorption from the sample is carbon dioxide from the general oxidation of the
-1
material. Absorption in the carbonyl region (1800-1700 cm ) suggests incomplete oxidation has also
taken place, generating some aldehydes, acids and possibly some ketones.