
Page 219 - Tandem Techniques
P. 219
Page 202
Figure 5.23 A shows he total ion current chromatogram from a sample of Rhine river water containing
200 ppt of the herbicides Atrazine and Simazine. The peaks are shown enlarged in the insert. Figure
5.23 B shows a section of the same chromatogram presented in the selected ion mode. It is seen that the
herbicide peaks are clearly and unambiguously revealed. In figures 5.23, C and D, the individual mass
spectra of Atrazine (eluted at 16. 30 minutes) and Simazine (eluted at 16.36 min.) are shown. The
spectra are clear and more than adequate to confirm the identity of the two herbicides.
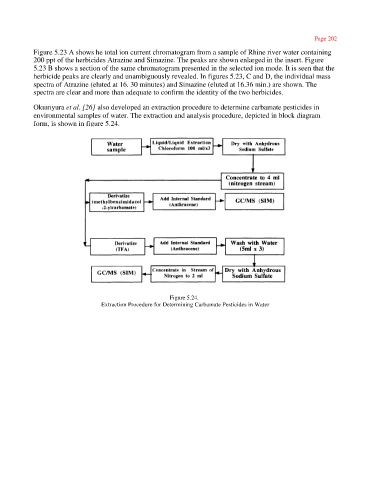
Okumyura et al. [26] also developed an extraction procedure to determine carbamate pesticides in
environmental samples of water. The extraction and analysis procedure, depicted in block diagram
form, is shown in figure 5.24.
Figure 5.24.
Extraction Procedure for Determining Carbamate Pesticides in Water