
Page 379 - Tandem Techniques
P. 379
Page 363
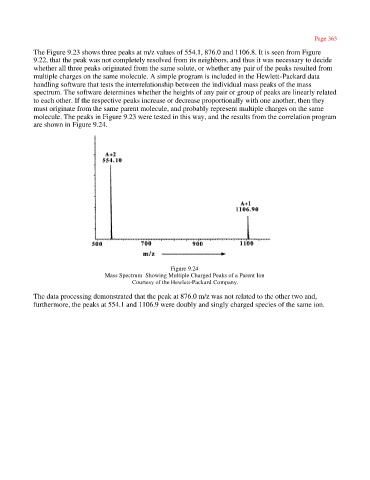
The Figure 9.23 shows three peaks at m/z values of 554.1, 876.0 and 1106.8. It is seen from Figure
9.22, that the peak was not completely resolved from its neighbors, and thus it was necessary to decide
whether all three peaks originated from the same solute, or whether any pair of the peaks resulted from
multiple charges on the same molecule. A simple program is included in the Hewlett-Packard data
handling software that tests the interrelationship between the individual mass peaks of the mass
spectrum. The software determines whether the heights of any pair or group of peaks are linearly related
to each other. If the respective peaks increase or decrease proportionally with one another, then they
must originate from the same parent molecule, and probably represent multiple charges on the same
molecule. The peaks in Figure 9.23 were tested in this way, and the results from the correlation program
are shown in Figure 9.24.
Figure 9.24
Mass Spectrum Showing Multiple Charged Peaks of a Parent Ion
Courtesy of the Hewlett-Packard Company.
The data processing demonstrated that the peak at 876.0 m/z was not related to the other two and,
furthermore, the peaks at 554.1 and 1106.9 were doubly and singly charged species of the same ion.