
Page 80 - Tandem Techniques
P. 80
Page 61
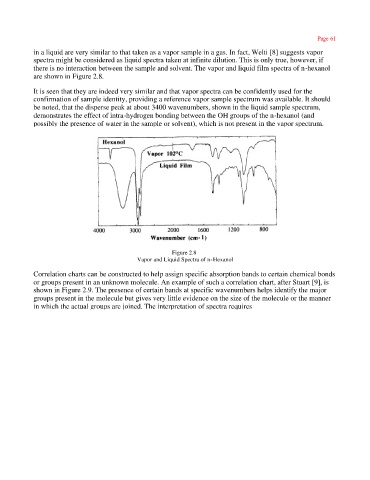
in a liquid are very similar to that taken as a vapor sample in a gas. In fact, Welti [8] suggests vapor
spectra might be considered as liquid spectra taken at infinite dilution. This is only true, however, if
there is no interaction between the sample and solvent. The vapor and liquid film spectra of n-hexanol
are shown in Figure 2.8.
It is seen that they are indeed very similar and that vapor spectra can be confidently used for the
confirmation of sample identity, providing a reference vapor sample spectrum was available. It should
be noted, that the disperse peak at about 3400 wavenumbers, shown in the liquid sample spectrum,
demonstrates the effect of intra-hydrogen bonding between the OH groups of the n-hexanol (and
possibly the presence of water in the sample or solvent), which is not present in the vapor spectrum.
Figure 2.8
Vapor and Liquid Spectra of n-Hexanol
Correlation charts can be constructed to help assign specific absorption bands to certain chemical bonds
or groups present in an unknown molecule. An example of such a correlation chart, after Stuart [9], is
shown in Figure 2.9. The presence of certain bands at specific wavenumbers helps identify the major
groups present in the molecule but gives very little evidence on the size of the molecule or the manner
in which the actual groups are joined. The interpretation of spectra requires