
Page 52 - Teach Yourself Electricity and Electronics
P. 52
32 Electrical units
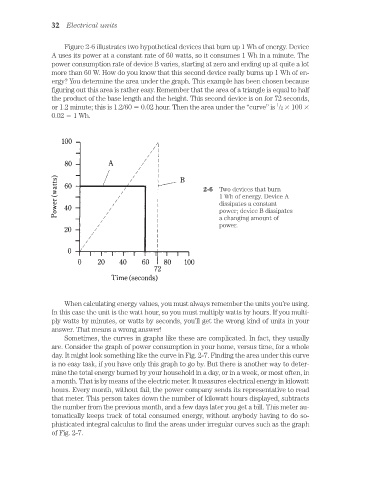
Figure 2-6 illustrates two hypothetical devices that burn up 1 Wh of energy. Device
A uses its power at a constant rate of 60 watts, so it consumes 1 Wh in a minute. The
power consumption rate of device B varies, starting at zero and ending up at quite a lot
more than 60 W. How do you know that this second device really burns up 1 Wh of en-
ergy? You determine the area under the graph. This example has been chosen because
figuring out this area is rather easy. Remember that the area of a triangle is equal to half
the product of the base length and the height. This second device is on for 72 seconds,
1
or 1.2 minute; this is 1.2/60 0.02 hour. Then the area under the “curve” is /2 100
0.02 1 Wh.
2-6 Two devices that burn
1 Wh of energy. Device A
dissipates a constant
power; device B dissipates
a changing amount of
power.
When calculating energy values, you must always remember the units you’re using.
In this case the unit is the watt hour, so you must multiply watts by hours. If you multi-
ply watts by minutes, or watts by seconds, you’ll get the wrong kind of units in your
answer. That means a wrong answer!
Sometimes, the curves in graphs like these are complicated. In fact, they usually
are. Consider the graph of power consumption in your home, versus time, for a whole
day. It might look something like the curve in Fig. 2-7. Finding the area under this curve
is no easy task, if you have only this graph to go by. But there is another way to deter-
mine the total energy burned by your household in a day, or in a week, or most often, in
a month. That is by means of the electric meter. It measures electrical energy in kilowatt
hours. Every month, without fail, the power company sends its representative to read
that meter. This person takes down the number of kilowatt hours displayed, subtracts
the number from the previous month, and a few days later you get a bill. This meter au-
tomatically keeps track of total consumed energy, without anybody having to do so-
phisticated integral calculus to find the areas under irregular curves such as the graph
of Fig. 2-7.