
Page 55 - Teach Yourself Electricity and Electronics
P. 55
Rectification and fluctuating direct current 35
maximum, or peak, voltage. In fact, for the common waveshape shown in Fig. 2-8, the
effective value is 0.707 times the peak value. Conversely, the peak value is 1.414 times
the effective value.
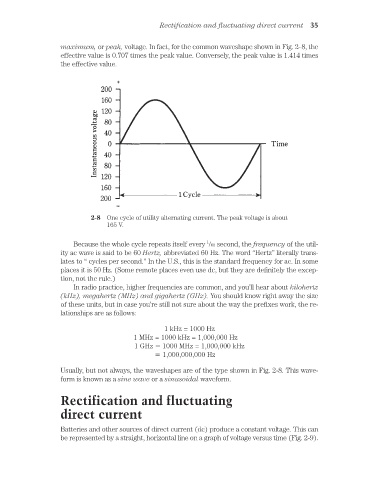
2-8 One cycle of utility alternating current. The peak voltage is about
165 V.
1
Because the whole cycle repeats itself every /60 second, the frequency of the util-
ity ac wave is said to be 60 Hertz, abbreviated 60 Hz. The word “Hertz” literally trans-
lates to “ cycles per second.” In the U.S., this is the standard frequency for ac. In some
places it is 50 Hz. (Some remote places even use dc, but they are definitely the excep-
tion, not the rule.)
In radio practice, higher frequencies are common, and you’ll hear about kilohertz
(kHz), megahertz (MHz) and gigahertz (GHz). You should know right away the size
of these units, but in case you’re still not sure about the way the prefixes work, the re-
lationships are as follows:
1 kHz = 1000 Hz
1 MHz = 1000 kHz = 1,000,000 Hz
1 GHz 1000 MHz = 1,000,000 kHz
1,000,000,000 Hz
Usually, but not always, the waveshapes are of the type shown in Fig. 2-8. This wave-
form is known as a sine wave or a sinusoidal waveform.
Rectification and fluctuating
direct current
Batteries and other sources of direct current (dc) produce a constant voltage. This can
be represented by a straight, horizontal line on a graph of voltage versus time (Fig. 2-9).