
Page 34 - The Art of Designing Embedded Systems
P. 34
Disciplined Development 2 1
programmer, maybe years from now, tries to change a line. When pre-
sented with a screen full of warnings, he’ll have no idea if these are normal
or a symptom of a newly induced problem.
Do the inspection post-compile but pre-test. Developers constantly
ask if they can do “a bit” of testing before the inspection-surely only to
reduce the embarrassment of finding dumb mistakes in front of their peers.
Sorry, but testing first negates most of the benefits. First, inspection is the
cheapest way to find bugs; the entire point of it is to avoid testing. Second,
all too often a pre-tested module never gets inspected. “Well, that sucker
works OK; why waste time inspecting it?”
Tune your inspection checklist. As you learn about the types of de-
fects you’re finding, add those to the checklist so the inspection process
benefits from actual experience.
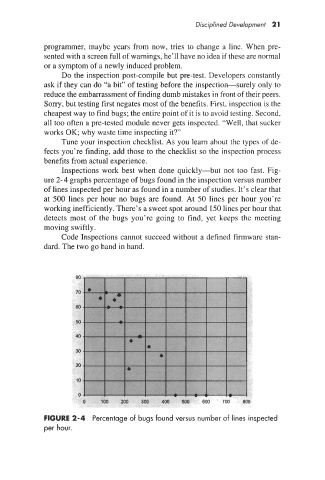
Inspections work best when done quickly-but not too fast. Fig-
ure 2-4 graphs percentage of bugs found in the inspection versus number
of lines inspected per hour as found in a number of studies. It’s clear that
at 500 lines per hour no bugs are found. At 50 lines per hour you’re
working inefficiently. There’s a sweet spot around 150 lines per hour that
detects most of the bugs you’re going to find, yet keeps the meeting
moving swiftly.
Code Inspections cannot succeed without a defined firmware stan-
dard. The two go hand in hand.
80
70
60
50
40
30
20
10
0
0 100 200 300 400 500 600 700 800
FIGURE 2-4 Percentage of bugs found versus number of lines inspected
per hour.