
Page 213 - Bruce Ellig - The Complete Guide to Executive Compensation (2007)
P. 213
Chapter 5. Salary 199
either reference points for merit increase values (e.g., break points for lower, middle and upper
one-third of range) or fixed rates for pay increases. If the latter is used, there is no opportunity
to use nonlisted values. In some situations, the two approaches may be combined (e.g., fixed
increments for the lower one-third or one-half of the range, with an open range for the remain-
der). Fixed increments are more likely to be found in nonprofits, especially the public sector,
than in the private sector. Because of their importance relative to incentives, salary ranges are
likely to be wider in the public sector than in the private, with the exception that executive salary
ranges are likely to be wider at the executive level than lower in the organization since execu-
tives are likely to remain in their range longer (due to decreased promotional opportunities).
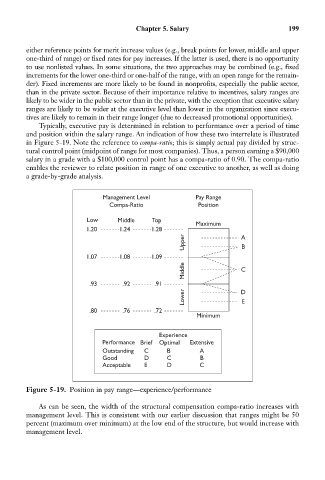
Typically, executive pay is determined in relation to performance over a period of time
and position within the salary range. An indication of how these two interrelate is illustrated
in Figure 5-19. Note the reference to compa-ratio; this is simply actual pay divided by struc-
tural control point (midpoint of range for most companies). Thus, a person earning a $90,000
salary in a grade with a $100,000 control point has a compa-ratio of 0.90. The compa-ratio
enables the reviewer to relate position in range of one executive to another, as well as doing
a grade-by-grade analysis.
Management Level Pay Range
Compa-Ratio Position
Low Middle Top
Maximum
1.20 1.24 1.28
Upper A
B
1.07 1.08 1.09
Middle C
.93 .92 .91
Lower D
E
.80 .76 .72
Minimum
Experience
Performance Brief Optimal Extensive
Outstanding C B A
Good D C B
Acceptable E D C
Figure 5-19. Position in pay range—experience/performance
As can be seen, the width of the structural compensation compa-ratio increases with
management level. This is consistent with our earlier discussion that ranges might be 50
percent (maximum over minimum) at the low end of the structure, but would increase with
management level.