
Page 264 - Bruce Ellig - The Complete Guide to Executive Compensation (2007)
P. 264
250 The Complete Guide to Executive Compensation
However, not everyone feels the need for a financial advisor; reasons include the
following:
1. They are sufficiently knowledgeable because of their work (or extensive hobby).
2. The World Wide Web not only makes information easily available, but also makes stock
transactions fast and relatively inexpensive.
3. Mutual funds make stock picking unnecessary.
4. Using an advisor still requires a lot of time, whereas doing it alone does not require a
great deal more time.
5. What is saved in fees and costs can be used to invest.
Avoiding Taxes. It is important to distinguish between tax avoidance (the legal means by
which the individual pays no more tax than is required by taking full advantage of tax law and
how different items are taxed) and tax evasion (the illegal means by which the individual pays
less tax than is required by understating income and/or overstating deductible expenses).
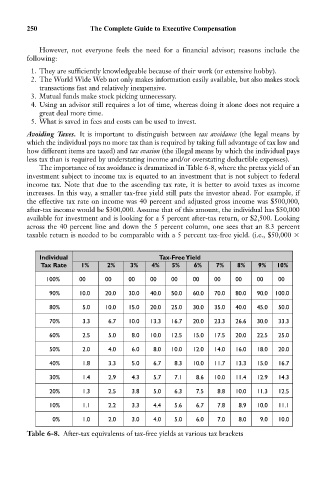
The importance of tax avoidance is dramatized in Table 6-8, where the pretax yield of an
investment subject to income tax is equated to an investment that is not subject to federal
income tax. Note that due to the ascending tax rate, it is better to avoid taxes as income
increases. In this way, a smaller tax-free yield still puts the investor ahead. For example, if
the effective tax rate on income was 40 percent and adjusted gross income was $500,000,
after-tax income would be $300,000. Assume that of this amount, the individual has $50,000
available for investment and is looking for a 5 percent after-tax return, or $2,500. Looking
across the 40 percent line and down the 5 percent column, one sees that an 8.3 percent
taxable return is needed to be comparable with a 5 percent tax-free yield. (i.e., $50,000
Individual Tax-FreeYield
Tax Rate 1% 2% 3% 4% 5% 6% 7% 8% 9% 10%
100% 00 00 00 00 00 00 00 00 00 00
90% 10.0 20.0 30.0 40.0 50.0 60.0 70.0 80.0 90.0 100.0
80% 5.0 10.0 15.0 20.0 25.0 30.0 35.0 40.0 45.0 50.0
70% 3.3 6.7 10.0 13.3 16.7 20.0 23.3 26.6 30.0 33.3
60% 2.5 5.0 8.0 10.0 12.5 15.0 17.5 20.0 22.5 25.0
50% 2.0 4.0 6.0 8.0 10.0 12.0 14.0 16.0 18.0 20.0
40% 1.8 3.3 5.0 6.7 8.3 10.0 11.7 13.3 15.0 16.7
30% 1.4 2.9 4.3 5.7 7.1 8.6 10.0 11.4 12.9 14.3
20% 1.3 2.5 3.8 5.0 6.3 7.5 8.8 10.0 11.3 12.5
10% 1.1 2.2 3.3 4.4 5.6 6.7 7.8 8.9 10.0 11.1
0% 1.0 2.0 3.0 4.0 5.0 6.0 7.0 8.0 9.0 10.0
Table 6-8. After-tax equivalents of tax-free yields at various tax brackets