
Page 385 - Bruce Ellig - The Complete Guide to Executive Compensation (2007)
P. 385
Chapter 7. Short-Term Incentives 371
3. Deductible/No target plan (C). The two types of plans in this category are share-
holder protection and economic profit plans. Both were reviewed earlier.
4. Deductible/Target plan (D). Similar to the no-deductible/target plan, an expected
level of payout is set, but in this case in relation to the net of the deductible. An exam-
ple of such a plan would be to combine Table 7-21 with a shareholder protection
formula so that payments would be made only to the extent financial results exceeded
the protection formula (e.g., 6 percent of shareholder equity). With an economic
profit approach, only financial results in excess of the cost of capital would permit
bonus payments.
Compound Growth
% of Normal Award Payable
in EPS over Period
15% and up 100% 125% 150% 175% 200%
13.0%–14.9% 75% 100% 125% 150% 175%
11.0%–12.9% 50% 75% 100% 125% 150%
9.0%–10.9% 25% 50% 75% 100% 125%
Below 9% 0% 25% 50% 75% 100%
Average return Below 10.0%– 12.0%– 14.0%– 16%
on capital 10% 11.9% 13.9% 15.9% and up
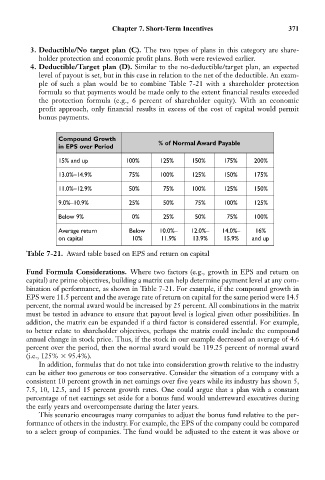
Table 7-21. Award table based on EPS and return on capital
Fund Formula Considerations. Where two factors (e.g., growth in EPS and return on
capital) are prime objectives, building a matrix can help determine payment level at any com-
bination of performance, as shown in Table 7-21. For example, if the compound growth in
EPS were 11.5 percent and the average rate of return on capital for the same period were 14.5
percent, the normal award would be increased by 25 percent. All combinations in the matrix
must be tested in advance to ensure that payout level is logical given other possibilities. In
addition, the matrix can be expanded if a third factor is considered essential. For example,
to better relate to shareholder objectives, perhaps the matrix could include the compound
annual change in stock price. Thus, if the stock in our example decreased an average of 4.6
percent over the period, then the normal award would be 119.25 percent of normal award
(i.e., 125% 95.4%).
In addition, formulas that do not take into consideration growth relative to the industry
can be either too generous or too conservative. Consider the situation of a company with a
consistent 10 percent growth in net earnings over five years while its industry has shown 5,
7.5, 10, 12.5, and 15 percent growth rates. One could argue that a plan with a constant
percentage of net earnings set aside for a bonus fund would underreward executives during
the early years and overcompensate during the later years.
This scenario encourages many companies to adjust the bonus fund relative to the per-
formance of others in the industry. For example, the EPS of the company could be compared
to a select group of companies. The fund would be adjusted to the extent it was above or