
Page 450 - Bruce Ellig - The Complete Guide to Executive Compensation (2007)
P. 450
436 The Complete Guide to Executive Compensation
Year Under $25 $25–50 $50–75 $75–100 $100–125 $125 Up
1 $18.50
2 $21.25
3 $28.25
4 $50.25
5 $56.50
6 $36.00
7 $57.50
8 $45.50
9 $78.70
10 $105.00
Total 2 3 3 1 1
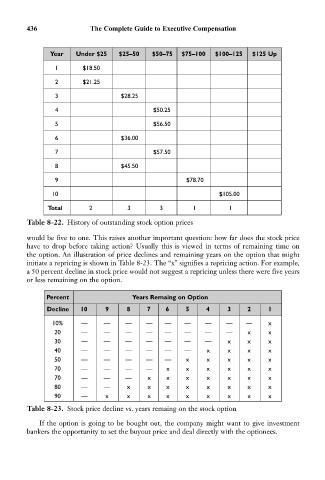
Table 8-22. History of outstanding stock option prices
would be five to one. This raises another important question: how far does the stock price
have to drop before taking action? Usually this is viewed in terms of remaining time on
the option. An illustration of price declines and remaining years on the option that might
initiate a repricing is shown in Table 8-23. The “x” signifies a repricing action. For example,
a 50 percent decline in stock price would not suggest a repricing unless there were five years
or less remaining on the option.
Percent Years Remaing on Option
Decline 10 9 8 7 6 5 4 3 2 1
10% — — — — — — — — — x
20 — — — — — — — — x x
30 — — — — — — — x x x
40 — — — — — — x x x x
50 — — — — — x x x x x
70 — — — — x x x x x x
70 — — — x x x x x x x
80 — — x x x x x x x x
90 — x x x x x x x x x
Table 8-23. Stock price decline vs. years remaing on the stock option
If the option is going to be bought out, the company might want to give investment
bankers the opportunity to set the buyout price and deal directly with the optionees.