
Page 447 - Bruce Ellig - The Complete Guide to Executive Compensation (2007)
P. 447
Chapter 8. Long-Term Incentives 433
Years
Growth Rate 10 20 30 40
1% $1.11 $1.22 $1.34 $1.49
2 1.22 1.49 1.81 2.21
3 1.34 1.81 2.43 3.26
4 1.48 2.19 3.24 4.80
5 1.63 2.65 4.32 7.04
6 1.79 3.21 5.74 10.29
7 1.97 3.87 7.61 14.97
8 2.16 4.66 10.06 21.73
9 2.37 5.60 13.27 31.41
10 2.59 6.73 17.45 45.26
11 2.84 8.06 22.89 65.00
12 3.11 9.65 29.96 93.05
13 3.40 11.52 39.12 132.78
14 3.71 13.74 50.95 188.88
15 4.05 16.37 66.21 267.86
16 4.41 19.46 85.85 378.72
17 4.81 23.11 111.07 533.87
18 5.23 27.39 143.37 750.38
19 5.70 32.43 184.68 1,051.67
20 6.19 38.34 237.38 1,469.77
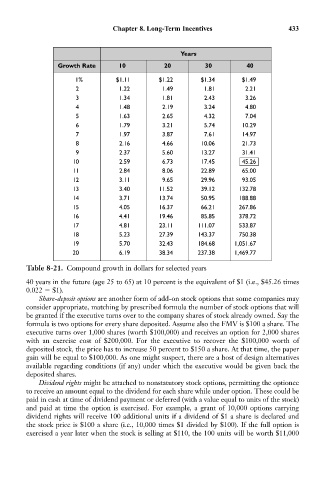
Table 8-21. Compound growth in dollars for selected years
40 years in the future (age 25 to 65) at 10 percent is the equivalent of $1 (i.e., $45.26 times
0.022 $1).
Share-deposit options are another form of add-on stock options that some companies may
consider appropriate, matching by prescribed formula the number of stock options that will
be granted if the executive turns over to the company shares of stock already owned. Say the
formula is two options for every share deposited. Assume also the FMV is $100 a share. The
executive turns over 1,000 shares (worth $100,000) and receives an option for 2,000 shares
with an exercise cost of $200,000. For the executive to recover the $100,000 worth of
deposited stock, the price has to increase 50 percent to $150 a share. At that time, the paper
gain will be equal to $100,000. As one might suspect, there are a host of design alternatives
available regarding conditions (if any) under which the executive would be given back the
deposited shares.
Dividend rights might be attached to nonstatutory stock options, permitting the optionee
to receive an amount equal to the dividend for each share while under option. These could be
paid in cash at time of dividend payment or deferred (with a value equal to units of the stock)
and paid at time the option is exercised. For example, a grant of 10,000 options carrying
dividend rights will receive 100 additional units if a dividend of $1 a share is declared and
the stock price is $100 a share (i.e., 10,000 times $1 divided by $100). If the full option is
exercised a year later when the stock is selling at $110, the 100 units will be worth $11,000