
Page 443 - Bruce Ellig - The Complete Guide to Executive Compensation (2007)
P. 443
Chapter 8. Long-Term Incentives 429
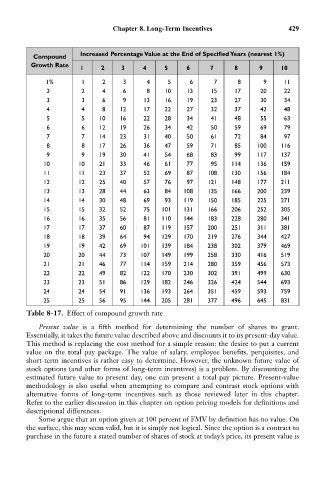
Increased Percentage Value at the End of Specified Years (nearest 1%)
Compound
Growth Rate
1 2 3 4 5 6 7 8 9 10
1% 1 2 3 4 5 6 7 8 9 11
2 2 4 6 8 10 13 15 17 20 22
3 3 6 9 13 16 19 23 27 30 34
4 4 8 12 17 22 27 32 37 42 48
5 5 10 16 22 28 34 41 48 55 63
6 6 12 19 26 34 42 50 59 69 79
7 7 14 23 31 40 50 61 72 84 97
8 8 17 26 36 47 59 71 85 100 116
9 9 19 30 41 54 68 83 99 117 137
10 10 21 33 46 61 77 95 114 136 159
11 11 23 37 52 69 87 108 130 156 184
12 12 25 40 57 76 97 121 148 177 211
13 13 28 44 63 84 108 135 166 200 239
14 14 30 48 69 93 119 150 185 225 271
15 15 32 52 75 101 131 166 206 252 305
16 16 35 56 81 110 144 183 228 280 341
17 17 37 60 87 119 157 200 251 311 381
18 18 39 64 94 129 170 219 276 344 427
19 19 42 69 101 139 184 238 302 379 469
20 20 44 73 107 149 199 258 330 416 519
21 21 46 77 114 159 214 280 359 456 573
22 22 49 82 122 170 230 302 391 499 630
23 23 51 86 129 182 246 326 424 544 693
24 24 54 91 136 193 264 351 459 593 759
25 25 56 95 144 205 281 377 496 645 831
Table 8-17. Effect of compound growth rate
Present value is a fifth method for determining the number of shares to grant.
Essentially, it takes the future value described above and discounts it to its present-day value.
This method is replacing the cost method for a simple reason: the desire to put a current
value on the total pay package. The value of salary, employee benefits, perquisites, and
short-term incentives is rather easy to determine. However, the unknown future value of
stock options (and other forms of long-term incentives) is a problem. By discounting the
estimated future value to present day, one can present a total pay picture. Present-value
methodology is also useful when attempting to compare and contrast stock options with
alternative forms of long-term incentives such as those reviewed later in this chapter.
Refer to the earlier discussion in this chapter on option pricing models for definitions and
descriptional differences.
Some argue that an option given at 100 percent of FMV by definition has no value. On
the surface, this may seem valid, but it is simply not logical. Since the option is a contract to
purchase in the future a stated number of shares of stock at today’s price, its present value is