
Page 439 - Bruce Ellig - The Complete Guide to Executive Compensation (2007)
P. 439
Chapter 8. Long-Term Incentives 425
two were combined in a survey, the data would lead a company using only stock options to
grant fewer shares than competitively appropriate. Conversely, the company using other
plans as well would likely grant more options than competitively suggested.
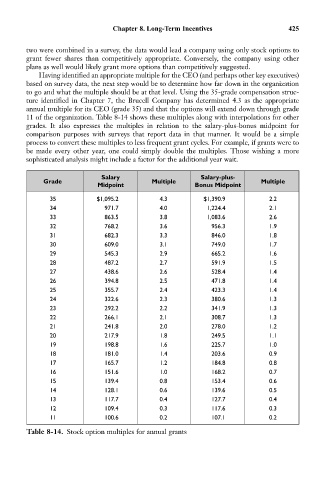
Having identified an appropriate multiple for the CEO (and perhaps other key executives)
based on survey data, the next step would be to determine how far down in the organization
to go and what the multiple should be at that level. Using the 35-grade compensation struc-
ture identified in Chapter 7, the Brucell Company has determined 4.3 as the appropriate
annual multiple for its CEO (grade 35) and that the options will extend down through grade
11 of the organization. Table 8-14 shows these multiples along with interpolations for other
grades. It also expresses the multiples in relation to the salary-plus-bonus midpoint for
comparison purposes with surveys that report data in that manner. It would be a simple
process to convert these multiples to less frequent grant cycles. For example, if grants were to
be made every other year, one could simply double the multiples. Those wishing a more
sophisticated analysis might include a factor for the additional year wait.
Salary Salary-plus-
Grade Multiple Multiple
Midpoint Bonus Midpoint
35 $1,095.2 4.3 $1,390.9 2.2
34 971.7 4.0 1,224.4 2.1
33 863.5 3.8 1,083.6 2.6
32 768.2 3.6 956.3 1.9
31 682.3 3.3 846.0 1.8
30 609.0 3.1 749.0 1.7
29 545.3 2.9 665.2 1.6
28 487.2 2.7 591.9 1.5
27 438.6 2.6 528.4 1.4
26 394.8 2.5 471.8 1.4
25 355.7 2.4 423.3 1.4
24 322.6 2.3 380.6 1.3
23 292.2 2.2 341.9 1.3
22 266.1 2.1 308.7 1.3
21 241.8 2.0 278.0 1.2
20 217.9 1.8 249.5 1.1
19 198.8 1.6 225.7 1.0
18 181.0 1.4 203.6 0.9
17 165.7 1.2 184.8 0.8
16 151.6 1.0 168.2 0.7
15 139.4 0.8 153.4 0.6
14 128.1 0.6 139.6 0.5
13 117.7 0.4 127.7 0.4
12 109.4 0.3 117.6 0.3
11 100.6 0.2 107.1 0.2
Table 8-14. Stock option multiples for annual grants