
Page 441 - Bruce Ellig - The Complete Guide to Executive Compensation (2007)
P. 441
Chapter 8. Long-Term Incentives 427
rather than precisely under, the column headers based on performance (and possible
promotability factors). This seven-column chart can either key to a performance-only rating
such as reported in Table 5-21 in Chapter 5 or a combination performance/promotability
rating as shown earlier in Table 8-7. On the other hand, a very simple guideline could be
constructed around the normal award (i.e., a “3” rating). Executives considered immediately
promotable would have their multiple adjusted by 1.25 (providing a 25 percent premium).
Conversely, executives considered either at their peak or no more than long-term promotion
candidates would be adjusted by a 0.75 factor (a 25 percent reduction).
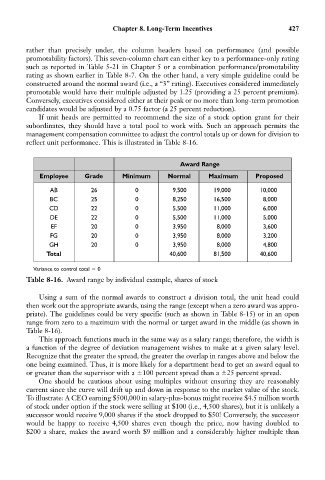
If unit heads are permitted to recommend the size of a stock option grant for their
subordinates, they should have a total pool to work with. Such an approach permits the
management compensation committee to adjust the control totals up or down for division to
reflect unit performance. This is illustrated in Table 8-16.
Award Range
Employee Grade Minimum Normal Maximum Proposed
AB 26 0 9,500 19,000 10,000
BC 25 0 8,250 16,500 8,000
CD 22 0 5,500 11,000 6,000
DE 22 0 5,500 11,000 5,000
EF 20 0 3,950 8,000 3,600
FG 20 0 3,950 8,000 3,200
GH 20 0 3,950 8,000 4,800
Total 40,600 81,500 40,600
Variance to control total 0
Table 8-16. Award range by individual example, shares of stock
Using a sum of the normal awards to construct a division total, the unit head could
then work out the appropriate awards, using the range (except when a zero award was appro-
priate). The guidelines could be very specific (such as shown in Table 8-15) or in an open
range from zero to a maximum with the normal or target award in the middle (as shown in
Table 8-16).
This approach functions much in the same way as a salary range; therefore, the width is
a function of the degree of deviation management wishes to make at a given salary level.
Recognize that the greater the spread, the greater the overlap in ranges above and below the
one being examined. Thus, it is more likely for a department head to get an award equal to
or greater than the supervisor with a 100 percent spread than a 25 percent spread.
One should be cautious about using multiples without ensuring they are reasonably
current since the curve will drift up and down in response to the market value of the stock.
To illustrate: A CEO earning $500,000 in salary-plus-bonus might receive $4.5 million worth
of stock under option if the stock were selling at $100 (i.e., 4,500 shares), but it is unlikely a
successor would receive 9,000 shares if the stock dropped to $50! Conversely, the successor
would be happy to receive 4,500 shares even though the price, now having doubled to
$200 a share, makes the award worth $9 million and a considerably higher multiple than