
Page 506 - Bruce Ellig - The Complete Guide to Executive Compensation (2007)
P. 506
492 The Complete Guide to Executive Compensation
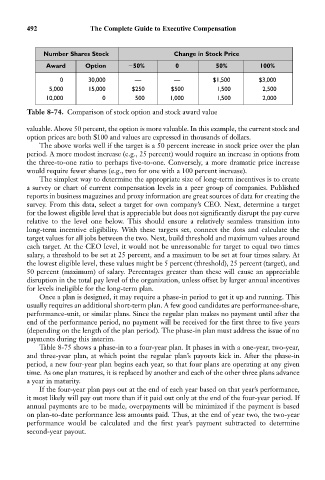
Number Shares Stock Change in Stock Price
Award Option 50% 0 50% 100%
0 30,000 — — $1,500 $3,000
5,000 15,000 $250 $500 1,500 2,500
10,000 0 500 1,000 1,500 2,000
Table 8-74. Comparison of stock option and stock award value
valuable. Above 50 percent, the option is more valuable. In this example, the current stock and
option prices are both $100 and values are expressed in thousands of dollars.
The above works well if the target is a 50 percent increase in stock price over the plan
period. A more modest increase (e.g., 25 percent) would require an increase in options from
the three-to-one ratio to perhaps five-to-one. Conversely, a more dramatic price increase
would require fewer shares (e.g., two for one with a 100 percent increase).
The simplest way to determine the appropriate size of long-term incentives is to create
a survey or chart of current compensation levels in a peer group of companies. Published
reports in business magazines and proxy information are great sources of data for creating the
survey. From this data, select a target for own company’s CEO. Next, determine a target
for the lowest eligible level that is appreciable but does not significantly disrupt the pay curve
relative to the level one below. This should ensure a relatively seamless transition into
long-term incentive eligibility. With these targets set, connect the dots and calculate the
target values for all jobs between the two. Next, build threshold and maximum values around
each target. At the CEO level, it would not be unreasonable for target to equal two times
salary, a threshold to be set at 25 percent, and a maximum to be set at four times salary. At
the lowest eligible level, these values might be 5 percent (threshold), 25 percent (target), and
50 percent (maximum) of salary. Percentages greater than these will cause an appreciable
disruption in the total pay level of the organization, unless offset by larger annual incentives
for levels ineligible for the long-term plan.
Once a plan is designed, it may require a phase-in period to get it up and running. This
usually requires an additional short-term plan. A few good candidates are performance-share,
performance-unit, or similar plans. Since the regular plan makes no payment until after the
end of the performance period, no payment will be received for the first three to five years
(depending on the length of the plan period). The phase-in plan must address the issue of no
payments during this interim.
Table 8-75 shows a phase-in to a four-year plan. It phases in with a one-year, two-year,
and three-year plan, at which point the regular plan’s payouts kick in. After the phase-in
period, a new four-year plan begins each year, so that four plans are operating at any given
time. As one plan matures, it is replaced by another and each of the other three plans advance
a year in maturity.
If the four-year plan pays out at the end of each year based on that year’s performance,
it most likely will pay out more than if it paid out only at the end of the four-year period. If
annual payments are to be made, overpayments will be minimized if the payment is based
on plan-to-date performance less amounts paid. Thus, at the end of year two, the two-year
performance would be calculated and the first year’s payment subtracted to determine
second-year payout.