Page 527 - Bruce Ellig - The Complete Guide to Executive Compensation (2007)
P. 527

Chapter 8. Long-Term Incentives                   513


                Compound                               Compound
                                     Number
                Increase in                            Increase in         Unit Value
                                     of Units
             Shareholder Value                      Return on Equity
                20% or more          2,000,000         20% or more           $2.00
                    19               1,900,000             19                 1.90
                    18               1,800,000             18                 1.80
                    17               1,700,000             17                 1.70
                    16               1,600,000             16                 1.60
                    15               1,500,000             15                 1.50
                    14               1,400,000             14                 1.40
                    13               1,300,000             13                 1.30
                    12               1,200,000             12                 1.20
                    11               1,100,000             11                 1.10
                    10               1,000,000             10                 1.00
                     9                750,000               9                 0.75
                     8                500,000               8                 0.50
                     7                250,000               7                 0.25
                  6 or less                0             6 or less               0
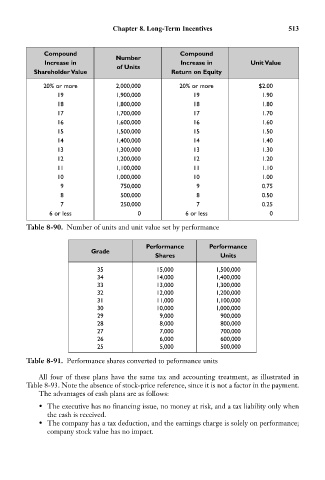
           Table 8-90. Number of units and unit value set by performance


                                             Performance       Performance
                              Grade
                                                Shares            Units
                               35               15,000           1,500,000
                               34               14,000           1,400,000
                               33               13,000           1,300,000
                               32               12,000           1,200,000
                               31               11,000           1,100,000
                               30               10,000           1,000,000
                               29                9,000             900,000
                               28                8,000             800,000
                               27                7,000             700,000
                               26                6,000             600,000
                               25                5,000             500,000

           Table 8-91. Performance shares converted to peformance units

               All four of these plans have the same tax and accounting treatment, as illustrated in
           Table 8-93. Note the absence of stock-price reference, since it is not a factor in the payment.
               The advantages of cash plans are as follows:
               • The executive has no financing issue, no money at risk, and a tax liability only when
                 the cash is received.
               • The company has a tax deduction, and the earnings charge is solely on performance;
                 company stock value has no impact.
   522   523   524   525   526   527   528   529   530   531   532