
Page 641 - Bruce Ellig - The Complete Guide to Executive Compensation (2007)
P. 641
626 The Complete Guide to Executive Compensation
Board pay Average Committee Pay Stock
Total Based Total
Company Retainer Mtg Fee Retainer Mtg Fee Cash Compensation Compensation
D $35,000 $24,000 $4,286 $17,143 $80,429 $23,000 $103,429
F $30,000 $19,200 $0 $9,891 $59,091 $32,200 $91,291
B $37,500 $12,350 $18,125 $5,106 $73,081 $15,475 $88,556
E $18,000 $9,000 $1,500 $12,000 $40,500 $41,063 $81,563
M $38,000 $12,000 $545 $10,364 $60,909 $16,667 $77,576
K $35,000 $10,000 $1,600 $9,300 $55,900 $18,025 $73,925
D $50,004 $0 $2,911 $0 $52,915 $20,000 $72,915
C $0 $8,000 $5,167 $9,000 $22,167 $39,000 $61,167
I $39,000 $9,000 $0 $6,778 $54,778 $6,233 $61,011
G $45,000 $0 $9,545 $3,818 $58,363 $2,000 $60,363
J $25,000 $14,000 $0 $7,800 $46,800 $0 $46,800
25th $27,500 $8,500 $273 $5,942 $49,858 $10,854 $61,089
percentile
Median $35,000 $10,000 $1,600 $9,000 $55,900 $18,025 $73,925
75th $38,500 $13,175 $4,727 $10,128 $60,000 $27,600 $85,059
percentile
Brucell $26,000 $16,500 $3,833 $7,125 $53,458 $29,850 $83,308
Difference
from
Median:
Dollars (9,000) 6,500 2,233 (1,875) (2,442) 11,825 9,383
Percent 25.7% 65.0% 139.6% 20.8% 4.4% 65.6% 12.7%
Note: Options valued at one-third grant cost. Zeros were included in all calculations.
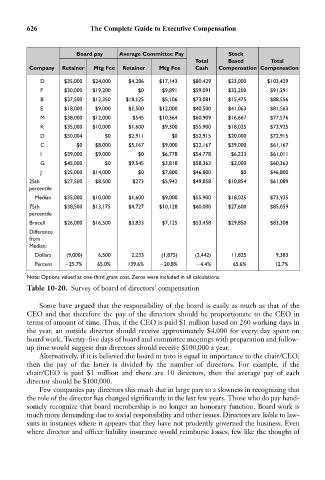
Table 10-20. Survey of board of directors’ compensation
Some have argued that the responsibility of the board is easily as much as that of the
CEO and that therefore the pay of the directors should be proportionate to the CEO in
terms of amount of time. Thus, if the CEO is paid $1 million based on 260 working days in
the year, an outside director should receive approximately $4,000 for every day spent on
board work. Twenty-five days of board and committee meetings with preparation and follow-
up time would suggest that directors should receive $100,000 a year.
Alternatively, if it is believed the board in toto is equal in importance to the chair/CEO,
then the pay of the latter is divided by the number of directors. For example, if the
chair/CEO is paid $1 million and there are 10 directors, then the average pay of each
director should be $100,000.
Few companies pay directors this much due in large part to a slowness in recognizing that
the role of the director has changed significantly in the last few years. Those who do pay hand-
somely recognize that board membership is no longer an honorary function. Board work is
much more demanding due to social responsibility and other issues. Directors are liable to law-
suits in instances where it appears that they have not prudently governed the business. Even
where director and officer liability insurance would reimburse losses, few like the thought of