
Page 87 - Bruce Ellig - The Complete Guide to Executive Compensation (2007)
P. 87
Chapter 2. Performance Measurements and Standards 73
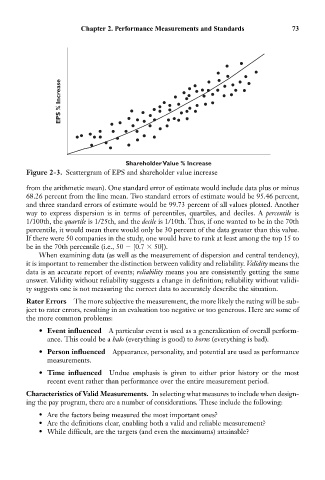
EPS % Increase
Shareholder Value % Increase
Figure 2-3. Scattergram of EPS and shareholder value increase
from the arithmetic mean). One standard error of estimate would include data plus or minus
68.26 percent from the line mean. Two standard errors of estimate would be 95.46 percent,
and three standard errors of estimate would be 99.73 percent of all values plotted. Another
way to express dispersion is in terms of percentiles, quartiles, and deciles. A percentile is
1/100th, the quartile is 1/25th, and the decile is 1/10th. Thus, if one wanted to be in the 70th
percentile, it would mean there would only be 30 percent of the data greater than this value.
If there were 50 companies in the study, one would have to rank at least among the top 15 to
be in the 70th percentile (i.e., 50 [0.7 50]).
When examining data (as well as the measurement of dispersion and central tendency),
it is important to remember the distinction between validity and reliability. Validity means the
data is an accurate report of events; reliability means you are consistently getting the same
answer. Validity without reliability suggests a change in definition; reliability without validi-
ty suggests one is not measuring the correct data to accurately describe the situation.
Rater Errors The more subjective the measurement, the more likely the rating will be sub-
ject to rater errors, resulting in an evaluation too negative or too generous. Here are some of
the more common problems:
• Event influenced A particular event is used as a generalization of overall perform-
ance. This could be a halo (everything is good) to horns (everything is bad).
• Person influenced Appearance, personality, and potential are used as performance
measurements.
• Time influenced Undue emphasis is given to either prior history or the most
recent event rather than performance over the entire measurement period.
Characteristics of Valid Measurements. In selecting what measures to include when design-
ing the pay program, there are a number of considerations. These include the following:
• Are the factors being measured the most important ones?
• Are the definitions clear, enabling both a valid and reliable measurement?
• While difficult, are the targets (and even the maximums) attainable?