
Page 133 - The Engineering Guide to LEED-New Construction Sustainable Construction for Engineers
P. 133
LEED W ater Ef ficiency 113
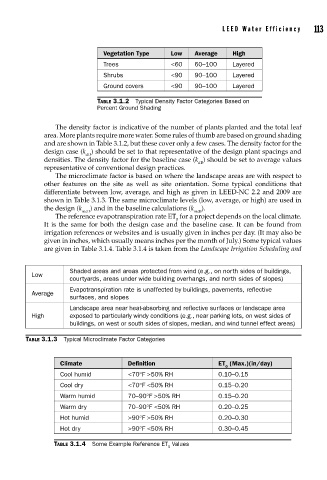
Vegetation Type Low Average High
Trees <60 60–100 Layered
Shrubs <90 90–100 Layered
Ground covers <90 90–100 Layered
TABLE 3.1.2 Typical Density Factor Categories Based on
Percent Ground Shading
The density factor is indicative of the number of plants planted and the total leaf
area. More plants require more water. Some rules of thumb are based on ground shading
and are shown in Table 3.1.2, but these cover only a few cases. The density factor for the
design case (k ) should be set to that representative of the design plant spacings and
dD
densities. The density factor for the baseline case (k ) should be set to average values
dB
representative of conventional design practices.
The microclimate factor is based on where the landscape areas are with respect to
other features on the site as well as site orientation. Some typical conditions that
differentiate between low, average, and high as given in LEED-NC 2.2 and 2009 are
shown in Table 3.1.3. The same microclimate levels (low, average, or high) are used in
the design (k ) and in the baseline calculations (k ).
mcD mcB
The reference evapotranspiration rate ET for a project depends on the local climate.
0
It is the same for both the design case and the baseline case. It can be found from
irrigation references or websites and is usually given in inches per day. (It may also be
given in inches, which usually means inches per the month of July.) Some typical values
are given in Table 3.1.4. Table 3.1.4 is taken from the Landscape Irrigation Scheduling and
Shaded areas and areas protected from wind (e.g., on north sides of buildings,
Low
courtyards, areas under wide building overhangs, and north sides of slopes)
Evapotranspiration rate is unaffected by buildings, pavements, reflective
Average
surfaces, and slopes
Landscape area near heat-absorbing and reflective surfaces or landscape area
High exposed to particularly windy conditions (e.g., near parking lots, on west sides of
buildings, on west or south sides of slopes, median, and wind tunnel effect areas)
TABLE 3.1.3 Typical Microclimate Factor Categories
Climate Definition ET (Max.)(in/day)
0
Cool humid <70°F >50% RH 0.10–0.15
Cool dry <70°F <50% RH 0.15–0.20
Warm humid 70–90°F >50% RH 0.15–0.20
Warm dry 70–90°F <50% RH 0.20–0.25
Hot humid >90°F >50% RH 0.20–0.30
Hot dry >90°F <50% RH 0.30–0.45
TABLE 3.1.4 Some Example Reference ET Values
0