
Page 53 - The extraordinary leader
P. 53
30 • The Extraordinary Leader
theme of this chapter and a major surprise finding of our research. We had
failed to appreciate fully just what a significant difference there is between
“ordinary” and “extraordinary.”
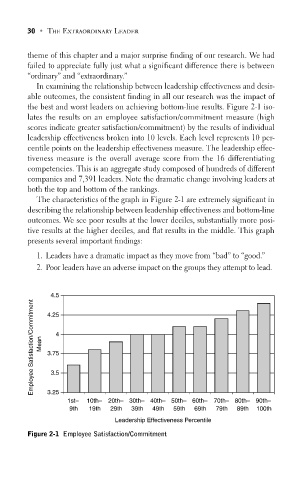
In examining the relationship between leadership effectiveness and desir-
able outcomes, the consistent finding in all our research was the impact of
the best and worst leaders on achieving bottom-line results. Figure 2-1 iso-
lates the results on an employee satisfaction/commitment measure (high
scores indicate greater satisfaction/commitment) by the results of individual
leadership effectiveness broken into 10 levels. Each level represents 10 per-
centile points on the leadership effectiveness measure. The leadership effec-
tiveness measure is the overall average score from the 16 differentiating
competencies. This is an aggregate study composed of hundreds of different
companies and 7,391 leaders. Note the dramatic change involving leaders at
both the top and bottom of the rankings.
The characteristics of the graph in Figure 2-1 are extremely significant in
describing the relationship between leadership effectiveness and bottom-line
outcomes. We see poor results at the lower deciles, substantially more posi-
tive results at the higher deciles, and flat results in the middle. This graph
presents several important findings:
1. Leaders have a dramatic impact as they move from “bad” to “good.”
2. Poor leaders have an adverse impact on the groups they attempt to lead.
4.5
Employee Satisfaction/Commitment Mean 3.75
4.25
4
3.5
3.25
1st– 10th– 20th– 30th– 40th– 50th– 60th– 70th– 80th– 90th–
9th 19th 29th 39th 49th 59th 69th 79th 89th 100th
Leadership Effectiveness Percentile
Figure 2-1 Employee Satisfaction/Commitment