
Page 123 - The Green Building Bottom Line The Real Cost of Sustainable Building
P. 123
102 CHAPTER 3
performance, firms that willingly adopt measures to reduce emissions and improve
environmental performance (rather than being forced, through regulation or other out-
side pressures) are seen in a better light by investors.
Finally, there are the numerous employee-related benefits discussed in Chapters 1
and 2. These include less employee turnover, greater productivity, higher retention
rates, and increased job satisfaction. While quantifying these benefits is difficult, there
are certainly real dollars attributable to each.
Beyond Carbon
A sustainability analysis can go far beyond carbon emissions. At Melaver, Inc., we
continually try to expand the scope of our environmental footprint reduction, each
year analyzing more criteria. For example, we reviewed 100 percent of our purchases
for the past year and were surprised by the results. Earlier in the chapter we discussed
the amount of soda purchased and the issue of recycling aluminum cans. The company
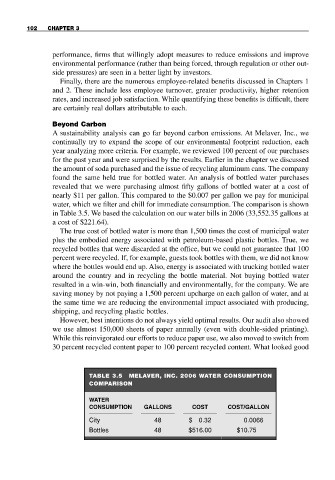
found the same held true for bottled water. An analysis of bottled water purchases
revealed that we were purchasing almost fifty gallons of bottled water at a cost of
nearly $11 per gallon. This compared to the $0.007 per gallon we pay for municipal
water, which we filter and chill for immediate consumption. The comparison is shown
in Table 3.5. We based the calculation on our water bills in 2006 (33,552.35 gallons at
a cost of $221.64).
The true cost of bottled water is more than 1,500 times the cost of municipal water
plus the embodied energy associated with petroleum-based plastic bottles. True, we
recycled bottles that were discarded at the office, but we could not guarantee that 100
percent were recycled. If, for example, guests took bottles with them, we did not know
where the bottles would end up. Also, energy is associated with trucking bottled water
around the country and in recycling the bottle material. Not buying bottled water
resulted in a win-win, both financially and environmentally, for the company. We are
saving money by not paying a 1,500 percent upcharge on each gallon of water, and at
the same time we are reducing the environmental impact associated with producing,
shipping, and recycling plastic bottles.
However, best intentions do not always yield optimal results. Our audit also showed
we use almost 150,000 sheets of paper annually (even with double-sided printing).
While this reinvigorated our efforts to reduce paper use, we also moved to switch from
30 percent recycled content paper to 100 percent recycled content. What looked good
TABLE 3.5 MELAVER, INC. 2006 WATER CONSUMPTION
COMPARISON
WATER
CONSUMPTION GALLONS COST COST/GALLON
City 48 $ 0.32 0.0066
Bottles 48 $516.00 $10.75