
Page 240 - The Green Building Bottom Line The Real Cost of Sustainable Building
P. 240
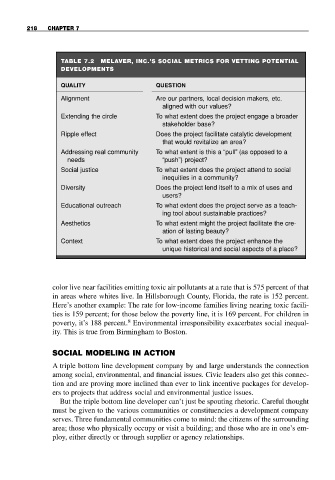
218  CHAPTER 7


                       TABLE 7.2  MELAVER, INC.’S SOCIAL METRICS FOR VETTING POTENTIAL
                       DEVELOPMENTS

                       QUALITY                    QUESTION
                       Alignment                  Are our partners, local decision makers, etc.
                                                    aligned with our values?
                       Extending the circle       To what extent does the project engage a broader
                                                    stakeholder base?
                       Ripple effect              Does the project facilitate catalytic development
                                                    that would revitalize an area?
                       Addressing real community   To what extent is this a “pull” (as opposed to a
                         needs                      “push”) project?
                       Social justice             To what extent does the project attend to social
                                                    inequities in a community?
                       Diversity                  Does the project lend itself to a mix of uses and
                                                    users?
                       Educational outreach       To what extent does the project serve as a teach-
                                                    ing tool about sustainable practices?
                       Aesthetics                 To what extent might the project facilitate the cre-
                                                    ation of lasting beauty?
                       Context                    To what extent does the project enhance the
                                                    unique historical and social aspects of a place?


                     color live near facilities emitting toxic air pollutants at a rate that is 575 percent of that
                     in areas where whites live. In Hillsborough County, Florida, the rate is 152 percent.
                     Here’s another example: The rate for low-income families living nearing toxic facili-
                     ties is 159 percent; for those below the poverty line, it is 169 percent. For children in
                                          8
                     poverty, it’s 188 percent. Environmental irresponsibility exacerbates social inequal-
                     ity. This is true from Birmingham to Boston.


                     SOCIAL MODELING IN ACTION
                     A triple bottom line development company by and large understands the connection
                     among social, environmental, and financial issues. Civic leaders also get this connec-
                     tion and are proving more inclined than ever to link incentive packages for develop-
                     ers to projects that address social and environmental justice issues.
                       But the triple bottom line developer can’t just be spouting rhetoric. Careful thought
                     must be given to the various communities or constituencies a development company
                     serves. Three fundamental communities come to mind: the citizens of the surrounding
                     area; those who physically occupy or visit a building; and those who are in one’s em-
                     ploy, either directly or through supplier or agency relationships.