
Page 93 - The Green Building Bottom Line The Real Cost of Sustainable Building
P. 93
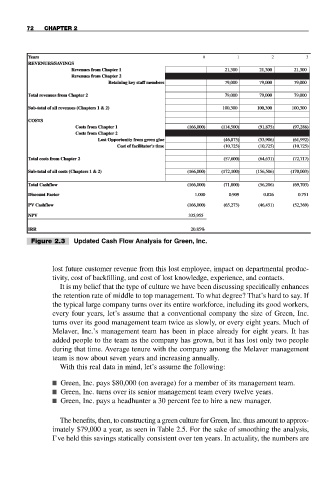
72 CHAPTER 2
ears
Y Years 0 1 2 3
REVENUES/SAVINGS
REVENUES/SA VINGS
21,300
21,300
21,300
Revenues fr om Chapter 1 21,300 21,300 21,300
Revenues from Chapter 1
om
Revenues from Chapter 2 2
fr
Revenues
Chapter
79,000
members
Retaining
79,000
Retaining key staff members 79,000 79,000 79,000
79,000
staff
key
Total rotal revenues frevenues from Chapterom Chapter 22 79,000 79,000 79,000
79,000
79,000
79,000
evenues
(Chapters
&
1
r
2)
100,300
100,300
Sub-total of all revenues (Chapters 1 & 2) 100,300 100,300 100,300
Sub-total
of
100,300
all
COSTS
COSTS
Costs from Chapter 1
(166,000)
Costs fr om Chapter 1 (166,000) (1 (114,500) (91,875) (97,286)
(91,875)
14,500)
(97,286)
om
Costs
fr
Chapter
Costs from Chapter 2 2
fr
om
(61,992)
Opportunity
gr
(46,875)
(53,906)
een
glue
Lost
Lost Opportunity from green glue (46,875) (53,906) (61,992)
Cost of facilitator's time (10,725) (10,725) (10,725)
(10,725)
(10,725)
Cost of facilitator's time
(10,725)
(72,717)
(64,631)
Total costs frotal costs from Chapterom Chapter 22 (57,600) (64,631) (72,717)
(57,600)
Sub-total of all costs (Chapters 1 & 2) (166,000) (172,100) (156,506) (170,003)
(166,000)
(172,100)
(156,506)
Sub-total of all costs (Chapters 1 & 2)
(170,003)
(69,703)
(71,800)
(166,000)
Total Cashflowotal Cashflow (166,000) (71,800) (56,206) (69,703)
(56,206)
Discount Factor 1.000 0.909 0.826 0.751
0.909
0.751
Factor
0.826
1.000
Discount
(52,369)
(46,451)
PV Cashflow
(65,273)
PV Cashflow (166,000) (65,273) (46,451) (52,369)
(166,000)
NPV 335,955
NPV
335,955
20.85%
IRR 20.85%
IRR
Figure 2.3 Updated Cash Flow Analysis for Green, Inc.
lost future customer revenue from this lost employee, impact on departmental produc-
tivity, cost of backfilling, and cost of lost knowledge, experience, and contacts.
It is my belief that the type of culture we have been discussing specifically enhances
the retention rate of middle to top management. To what degree? That’s hard to say. If
the typical large company turns over its entire workforce, including its good workers,
every four years, let’s assume that a conventional company the size of Green, Inc.
turns over its good management team twice as slowly, or every eight years. Much of
Melaver, Inc.’s management team has been in place already for eight years. It has
added people to the team as the company has grown, but it has lost only two people
during that time. Average tenure with the company among the Melaver management
team is now about seven years and increasing annually.
With this real data in mind, let’s assume the following:
■ Green, Inc. pays $80,000 (on average) for a member of its management team.
■ Green, Inc. turns over its senior management team every twelve years.
■ Green, Inc. pays a headhunter a 30 percent fee to hire a new manager.
The benefits, then, to constructing a green culture for Green, Inc. thus amount to approx-
imately $79,000 a year, as seen in Table 2.5. For the sake of smoothing the analysis,
I’ve held this savings statically consistent over ten years. In actuality, the numbers are