
Page 309 - The Handbook for Quality Management a Complete Guide to Operational Excellence
P. 309
296 C o n t i n u o u s I m p r o v e m e n t M e a s u r e S t a g e 297
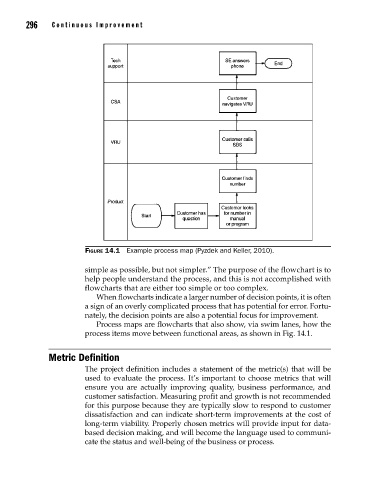
Figure 14.1 Example process map (Pyzdek and Keller, 2010).
simple as possible, but not simpler.” The purpose of the flowchart is to
help people understand the process, and this is not accomplished with
flowcharts that are either too simple or too complex.
When flowcharts indicate a larger number of decision points, it is often
a sign of an overly complicated process that has potential for error. Fortu-
nately, the decision points are also a potential focus for improvement.
Process maps are flowcharts that also show, via swim lanes, how the
process items move between functional areas, as shown in Fig. 14.1.
Metric Definition
The project definition includes a statement of the metric(s) that will be
used to evaluate the process. It’s important to choose metrics that will
ensure you are actually improving quality, business performance, and
customer satis faction. Measuring profit and growth is not recommended
for this purpose because they are typically slow to respond to cus tomer
dissatisfaction and can indicate short-term improvements at the cost of
long-term viability. Properly chosen metrics will provide input for data-
based decision making, and will become the language used to communi-
cate the sta tus and well-being of the business or process.
14_Pyzdek_Ch14_p293-304.indd 296 11/20/12 10:32 PM