
Page 312 - The Handbook for Quality Management a Complete Guide to Operational Excellence
P. 312
298 C o n t i n u o u s I m p r o v e m e n t M e a s u r e S t a g e 299
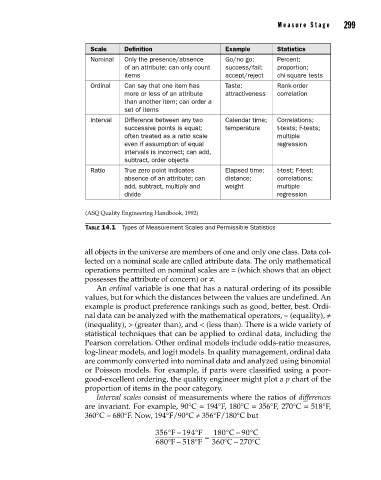
Scale Definition Example Statistics
Nominal Only the presence/absence Go/no go; Percent;
of an attribute; can only count success/fail; proportion;
items accept/reject chi-square tests
Ordinal Can say that one item has Taste; Rank-order
more or less of an attribute attractiveness correlation
than another item; can order a
set of items
Interval Difference between any two Calendar time; Correlations;
successive points is equal; temperature t-tests; F-tests;
often treated as a ratio scale multiple
even if assumption of equal regression
intervals is incorrect; can add,
subtract, order objects
Ratio True zero point indicates Elapsed time; t-test; F-test;
absence of an attribute; can distance; correlations;
add, subtract, multiply and weight multiple
divide regression
(ASQ Quality Engineering Handbook, 1992)
Table 14.1 Types of Measurement Scales and Permissible Statistics
all objects in the universe are members of one and only one class. Data col-
lected on a nominal scale are called attribute data. The only mathematical
operations permitted on nominal scales are = (which shows that an object
possesses the attribute of concern) or ≠.
An ordinal variable is one that has a natural ordering of its possible
values, but for which the distances between the values are undefined. An
example is product preference rankings such as good, better, best. Ordi-
nal data can be analyzed with the mathematical operators, = (equality), ≠
(inequality), > (greater than), and < (less than). There is a wide variety of
statistical tech niques that can be applied to ordinal data, including the
Pearson correlation. Other ordinal models include odds-ratio measures,
log-linear models, and logit models. In quality management, ordinal data
are com monly converted into nominal data and analyzed using binomial
or Poisson models. For example, if parts were classified using a poor-
good-excellent ordering, the quality engineer might plot a p chart of the
proportion of items in the poor category.
Interval scales consist of measurements where the ratios of differences
are invariant. For example, 90°C = 194°F, 180°C = 356°F, 270°C = 518°F,
360°C = 680°F. Now, 194°F/90°C ≠ 356°F/180°C but
356° − 194°F 180° − 90°C
F
C
C
C
680 ° − 518 °F = 360 ° − 270 °C
F
14_Pyzdek_Ch14_p293-304.indd 299 11/20/12 10:32 PM