
Page 104 - The Handbook of Persuasion and Social Marketing
P. 104
Persuasion in the Political Context 97
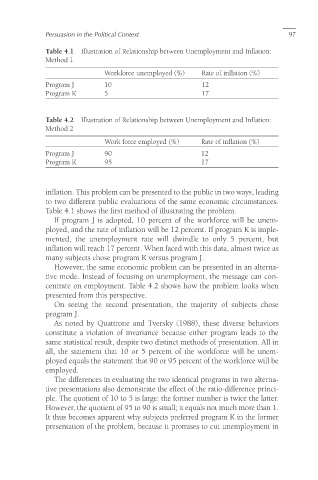
table 4.1 Illustration of Relationship between Unemployment and Inflation:
Method 1
Workforce unemployed (%) Rate of inflation (%)
Program J 10 12
Program K 5 17
table 4.2 Illustration of Relationship between Unemployment and Inflation:
Method 2
Work force employed (%) Rate of inflation (%)
Program J 90 12
Program K 95 17
inflation. This problem can be presented to the public in two ways, leading
to two different public evaluations of the same economic circumstances.
Table 4.1 shows the first method of illustrating the problem.
If program J is adopted, 10 percent of the workforce will be unem-
ployed, and the rate of inflation will be 12 percent. If program K is imple-
mented, the unemployment rate will dwindle to only 5 percent, but
inflation will reach 17 percent. When faced with this data, almost twice as
many subjects chose program K versus program J.
However, the same economic problem can be presented in an alterna-
tive mode. Instead of focusing on unemployment, the message can con-
centrate on employment. Table 4.2 shows how the problem looks when
presented from this perspective.
On seeing the second presentation, the majority of subjects chose
program J.
As noted by Quattrone and Tversky (1988), these diverse behaviors
constitute a violation of invariance because either program leads to the
same statistical result, despite two distinct methods of presentation. All in
all, the statement that 10 or 5 percent of the workforce will be unem-
ployed equals the statement that 90 or 95 percent of the workforce will be
employed.
The differences in evaluating the two identical programs in two alterna-
tive presentations also demonstrate the effect of the ratio-difference princi-
ple. The quotient of 10 to 5 is large: the former number is twice the latter.
However, the quotient of 95 to 90 is small; it equals not much more than 1.
It thus becomes apparent why subjects preferred program K in the former
presentation of the problem, because it promises to cut unemployment in