
Page 202 - The Making of the German Post-war Economy
P. 202
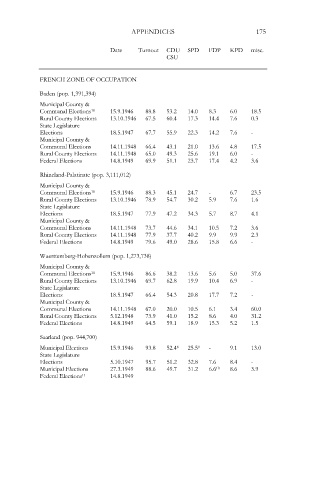
APPENDICES                     175

                             Date   Turnout  CDU  SPD  FDP  KPD  misc.
                                            CSU


           FRENCH ZONE OF OCCUPATION

           Baden (pop. 1,391,394)
           Municipal County &
           Communal Elections 10  15.9.1946  88.8  53.2  14.0  8.3  6.0  18.5
           Rural County Elections    13.10.1946  67.5  60.4  17.3  14.4  7.6  0.3
           State Legislature
           Elections         18.5.1947  67.7  55.9  22.3  14.2  7.6  -
           Municipal County &
           Communal Elections  14.11.1948  66.4  43.1  21.0  13.6  4.8  17.5
           Rural County  Elections  14.11.1948  65.0  49.3  25.6  19.1  6.0  -
           Federal Elections  14.8.1949  69.9  51.1  23.7  17.4  4.2  3.6

           Rhineland-Palatinate (pop. 3,111,012)
           Municipal County &
           Communal Elections 10  15.9.1946  88.3  45.1  24.7  -  6.7  23.5
           Rural County Elections    13.10.1946  78.9  54.7  30.2  5.9  7.6  1.6
           State Legislature
           Elections         18.5.1947  77.9  47.2  34.3  5.7  8.7  4.1
           Municipal County &
           Communal Elections  14.11.1948  73.7  44.6  34.1  10.5  7.2  3.6
           Rural County  Elections  14.11.1948  77.9  37.7  40.2  9.9  9.9  2.3
           Federal Elections  14.8.1949  79.6  49.0  28.6  15.8  6.6  -

           Wuerttemberg-Hohenzollern (pop. 1,273,738)
           Municipal County &
           Communal Elections 10  15.9.1946  86.6  38.2  13.6  5.6  5.0  37.6
           Rural County Elections    13.10.1946  69.7  62.8  19.9  10.4  6.9  -
           State Legislature
           Elections         18.5.1947  66.4  54.3  20.8  17.7  7.2  -
           Municipal County &
           Communal Elections  14.11.1948  67.0  20.0  10.5  6.1  3.4  60.0
           Rural County  Elections  5.12.1948  73.9  41.0  15.2  8.6  4.0  31.2
           Federal Elections  14.8.1949  64.5  59.1  18.9  15.3  5.2  1.5

           Saarland (pop. 944,700)
           Municipal Elections   15.9.1946   93.8   52.4 8  25.5 9  -  9.1  13.0
           State Legislature
           Elections         5.10.1947  95.7  51.2  32.8  7.6  8.4  -
           Municipal Elections  27.3.1949  88.6  49.7  31.2  6.6 10  8.6  3.9
           Federal Elections 11  14.8.1949