
Page 87 - The Master Handbook Of Acoustics
P. 87
62 CHAPTER THREE
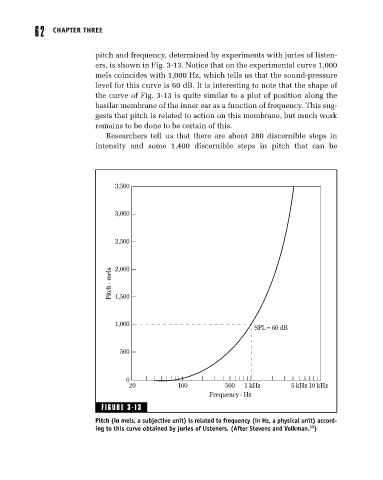
pitch and frequency, determined by experiments with juries of listen-
ers, is shown in Fig. 3-13. Notice that on the experimental curve 1,000
mels coincides with 1,000 Hz, which tells us that the sound-pressure
level for this curve is 60 dB. It is interesting to note that the shape of
the curve of Fig. 3-13 is quite similar to a plot of position along the
basilar membrane of the inner ear as a function of frequency. This sug-
gests that pitch is related to action on this membrane, but much work
remains to be done to be certain of this.
Researchers tell us that there are about 280 discernible steps in
intensity and some 1,400 discernible steps in pitch that can be
3,500
3,000
2,500
Pitch - mels 2,000
1,500
1,000
SPL = 60 dB
500
0
20 100 500 1 kHz 5 kHz 10 kHz
Frequency - Hz
FIGURE 3-13
Pitch (in mels, a subjective unit) is related to frequency (in Hz, a physical unit) accord-
13
ing to this curve obtained by juries of listeners. (After Stevens and Volkman. )