
Page 82 - The Master Handbook Of Acoustics
P. 82
57
THE EAR AND THE PERCEPTION OF SOUND
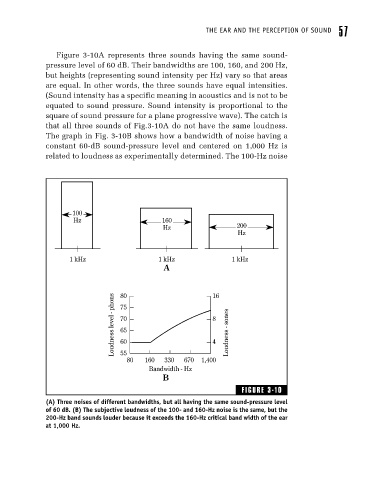
Figure 3-10A represents three sounds having the same sound-
pressure level of 60 dB. Their bandwidths are 100, 160, and 200 Hz,
but heights (representing sound intensity per Hz) vary so that areas
are equal. In other words, the three sounds have equal intensities.
(Sound intensity has a specific meaning in acoustics and is not to be
equated to sound pressure. Sound intensity is proportional to the
square of sound pressure for a plane progressive wave). The catch is
that all three sounds of Fig.3-10A do not have the same loudness.
The graph in Fig. 3-10B shows how a bandwidth of noise having a
constant 60-dB sound-pressure level and centered on 1,000 Hz is
related to loudness as experimentally determined. The 100-Hz noise
100
Hz 160
Hz 200
Hz
1 kHz 1 kHz 1 kHz
A
Loudness level - phons 80 16 Loudness - sones
75
8
70
65
4
60
55
80 160 330 670 1,400
Bandwidth - Hz
B
FIGURE 3-10
(A) Three noises of different bandwidths, but all having the same sound-pressure level
of 60 dB. (B) The subjective loudness of the 100- and 160-Hz noise is the same, but the
200-Hz band sounds louder because it exceeds the 160-Hz critical band width of the ear
at 1,000 Hz.