
Page 78 - The Master Handbook Of Acoustics
P. 78
53
THE EAR AND THE PERCEPTION OF SOUND
and phono pickups differs from brand to brand and circuit to circuit. Lis-
tening-room conditions vary from dead to highly reverberant. With all of
these variables, how can a manufacturer design a loudness control truly
geared to the sound-pressure level at the ear of listener x with the partic-
ular variables of x’s equipment and x’s listening environment? For a
loudness control to function properly, x’s system must be calibrated and
the loudness control fitted to it. 9
Area of Audibility
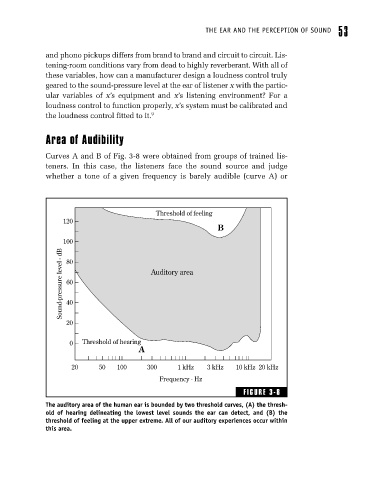
Curves A and B of Fig. 3-8 were obtained from groups of trained lis-
teners. In this case, the listeners face the sound source and judge
whether a tone of a given frequency is barely audible (curve A) or
Threshold of feeling
120
B
100
Sound-pressure level - dB 60 Auditory area
80
40
20
0 Threshold of hearing
A
20 50 100 300 1 kHz 3 kHz 10 kHz 20 kHz
Frequency - Hz
FIGURE 3-8
The auditory area of the human ear is bounded by two threshold curves, (A) the thresh-
old of hearing delineating the lowest level sounds the ear can detect, and (B) the
threshold of feeling at the upper extreme. All of our auditory experiences occur within
this area.