
Page 174 - The Petroleum System From Source to Trap
P. 174
166 Deming
AGE(Ma)
200 100 0
w
�
w
0 2
�
:::J E 3
CIJ ->::
0 4
� 1000
1- 5
6
AGE (Ma)
300 200 1 0 0 0
0 �--��--����----�--����
3 � �
2
� �
4
5 P A SSIVE MARGINS
6
������==�==�==�
600 500 400 300
Sallnlan t.ln
AGE (Ma)
500 400 300
-.;;;;;;;::
2 Williston Basin 2
3 3
� �
4 INTRACRATONIC BASINS 4
5 5
6 �--�-----=�=� 6
AGE (Ma)
0
2
3
�
4
CE FORELAND BASINS
5 5
9 � �
� 100
6 , 6
500 400
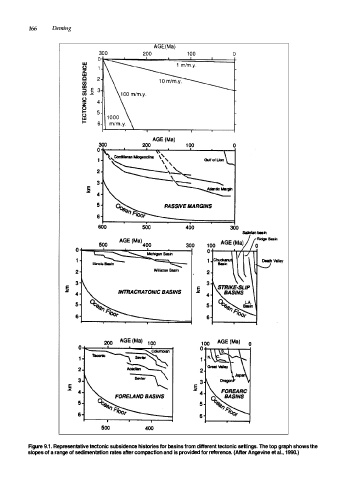
Figure 9.1. Representative tectonic subsidence histories for basins from different tectonic settings. The top graph shows the
slopes of a range of sedimentation rates after compaction and is provided for reference. (After Angevine et al., 1990.)