
Page 65 - The Six Sigma Project Planner
P. 65
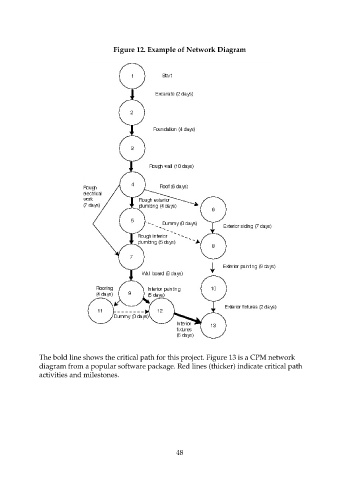
Figure 12. Example of Network Diagram


                    The bold line shows the critical path for this project. Figure 13 is a CPM network
                    diagram from a popular software package. Red lines (thicker) indicate critical path
                    activities and milestones.


                                                             48