
Page 60 - The Six Sigma Project Planner
P. 60
Gantt charts and milestone charts can be modified to show additional information, such
as who is responsible for a task, why a task is behind schedule, remedial action planned
or already taken, etc. They are excellent tools for presenting a great deal of information
in an easy-to-understand format.
Computer-Generated Gantt Charts
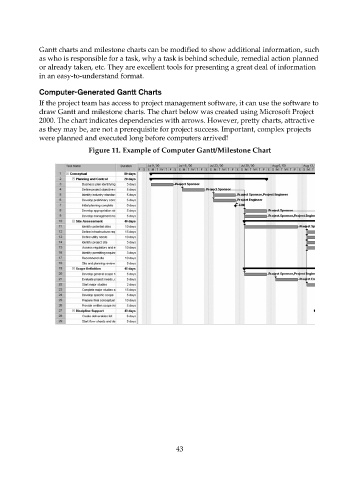
If the project team has access to project management software, it can use the software to
draw Gantt and milestone charts. The chart below was created using Microsoft Project
2000. The chart indicates dependencies with arrows. However, pretty charts, attractive
as they may be, are not a prerequisite for project success. Important, complex projects
were planned and executed long before computers arrived!
Figure 11. Example of Computer Gantt/Milestone Chart
43