
Page 59 - The Six Sigma Project Planner
P. 59
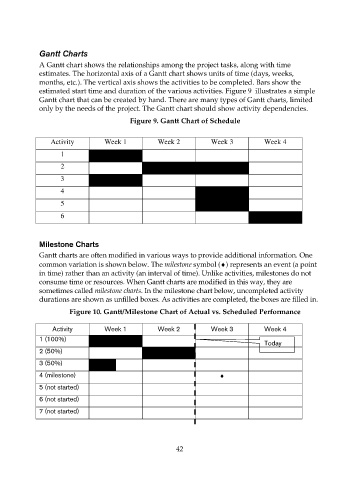
Gantt Charts
                    A Gantt chart shows the relationships among the project tasks, along with time
                    estimates. The horizontal axis of a Gantt chart shows units of time (days, weeks,
                    months, etc.). The vertical axis shows the activities to be completed. Bars show the
                    estimated start time and duration of the various activities. Figure 9  illustrates a simple
                    Gantt chart that can be created by hand. There are many types of Gantt charts, limited
                    only by the needs of the project. The Gantt chart should show activity dependencies.

                                               Figure 9. Gantt Chart of Schedule


                       Activity         Week 1          Week 2         Week 3          Week 4
                          1
                          2
                          3

                          4
                          5

                          6


                    Milestone Charts
                    Gantt charts are often modified in various ways to provide additional information. One
                    common variation is shown below. The milestone symbol (♦) represents an event (a point
                    in time) rather than an activity (an interval of time). Unlike activities, milestones do not
                    consume time or resources. When Gantt charts are modified in this way, they are
                    sometimes called milestone charts. In the milestone chart below, uncompleted activity
                    durations are shown as unfilled boxes. As activities are completed, the boxes are filled in.
                             Figure 10. Gantt/Milestone Chart of Actual vs. Scheduled Performance


                        Activity        Week 1          Week 2          Week 3          Week 4
                    1 (100%)
                                                                                        Today
                    2 (50%)
                    3 (50%)
                    4 (milestone)                                         ♦

                    5  (not  started)
                    6  (not  started)
                    7  (not  started)


                                                             42