
Page 227 -
P. 227
The Greening of IT
192 How Companies Can Make a Difference for the Environment
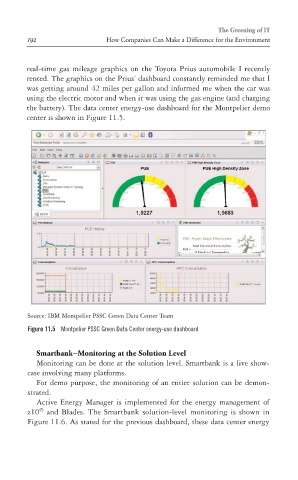
real-time gas mileage graphics on the Toyota Prius automobile I recently
rented. The graphics on the Prius’ dashboard constantly reminded me that I
was getting around 42 miles per gallon and informed me when the car was
using the electric motor and when it was using the gas engine (and charging
the battery). The data center energy-use dashboard for the Montpelier demo
center is shown in Figure 11.5.
ptg
Source: IBM Montpelier PSSC Green Data Center Team
Figure 11.5 Montpelier PSSC Green Data Center energy-use dashboard
Smartbank—Monitoring at the Solution Level
Monitoring can be done at the solution level. Smartbank is a live show-
case involving many platforms.
For demo purpose, the monitoring of an entire solution can be demon-
strated.
Active Energy Manager is implemented for the energy management of
®
z10 and Blades. The Smartbank solution-level monitoring is shown in
Figure 11.6. As stated for the previous dashboard, these data center energy