
Page 262 -
P. 262
Appendix A
Green IT Checklist and Recommendations 227
Installed Units Volume Mid-Range High-End Total/
Base Avg.
2005
U.S. Thousands 9,897 387 22 10,306
Western Europe Thousands 6,985 356 15 7,355
Japan Thousands 2,361 185 12 2,558
Asia Pacific Thousands 3,553 137 4 3,694
(ex. Japan)
Rest of World Thousands 3,162 199 7 3,368
Total Thousands 25,959 1264 59 27,282
Average Power Units Volume Mid-Range High-End Total/Avg.
Used per Server
2000
U.S. Watts/server 186 424 5534 236
Western Europe Watts/server 181 422 4517 227
Japan Watts/server 181 422 4517 271
Asia Pacific Watts/server 181 422 4517 212
(ex. Japan)
Rest of World Watts/server 181 422 4517 246 ptg
Total Watts/server 183 423 4874 236
2005
U.S. Watts/server 219 625 7651 250
Western Europe Watts/server 224 598 8378 258
Japan Watts/server 224 598 8378 289
Asia Pacific Watts/server 224 598 8378 247
(ex. Japan)
Rest of World Watts/server 224 598 8378 263
Total Watts/server 222 607 8106 257
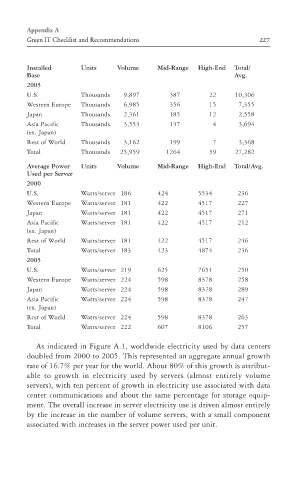
As indicated in Figure A.1, worldwide electricity used by data centers
doubled from 2000 to 2005. This represented an aggregate annual growth
rate of 16.7% per year for the world. About 80% of this growth is attribut-
able to growth in electricity used by servers (almost entirely volume
servers), with ten percent of growth in electricity use associated with data
center communications and about the same percentage for storage equip-
ment. The overall increase in server electricity use is driven almost entirely
by the increase in the number of volume servers, with a small component
associated with increases in the server power used per unit.