
Page 263 -
P. 263
The Greening of IT
228 How Companies Can Make a Difference for the Environment
180
1% of
160 world total
Energy use (billion kWh/year) 120 world total Infrastructure Cooling +
140
power
distribution
100
0.5% of
Communications
80
Storage
60
40
Mid-range servers
Volume servers
20 High-end servers IT load
0
2000 2005
Source: Koomey report from Lawrence Berkeley National Lab (LBNL)
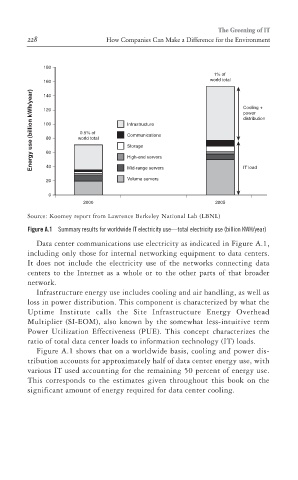
Figure A.1 Summary results for worldwide IT electricity use—total electricity use (billion KWH/year)
ptg
Data center communications use electricity as indicated in Figure A.1,
including only those for internal networking equipment to data centers.
It does not include the electricity use of the networks connecting data
centers to the Internet as a whole or to the other parts of that broader
network.
Infrastructure energy use includes cooling and air handling, as well as
loss in power distribution. This component is characterized by what the
Uptime Institute calls the Site Infrastructure Energy Overhead
Multiplier (SI-EOM), also known by the somewhat less-intuitive term
Power Utilization Effectiveness (PUE). This concept characterizes the
ratio of total data center loads to information technology (IT) loads.
Figure A.1 shows that on a worldwide basis, cooling and power dis-
tribution accounts for approximately half of data center energy use, with
various IT used accounting for the remaining 50 percent of energy use.
This corresponds to the estimates given throughout this book on the
significant amount of energy required for data center cooling.