
Page 467 - Thomson, William Tyrrell-Theory of Vibration with Applications-Taylor _ Francis (2010)
P. 467
454 Random Vibrations Chap. 13
Figure P13-16.
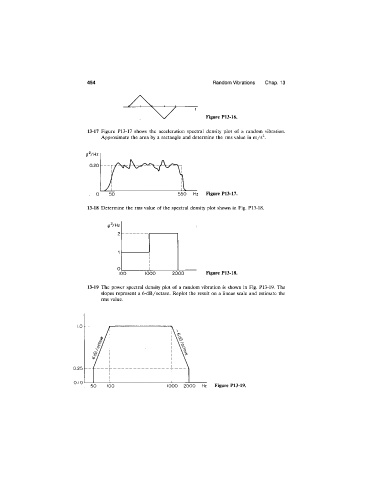
13-17 Figure P13-17 shows the acceleration spectral density plot of a random vibration.
Approximate the area by a rectangle and determine the rms value in m/s^.
13-18 Determine the rms value of the spectral density plot shown in Fig. P13-18.
100 1000 2000 Figure P13-18.
13-19 The power spectral density plot of a random vibration is shown in Fig. P13-19. The
slopes represent a 6-dB/octave. Replot the result on a linear scale and estimate the
rms value.
1000 2000 Hz Figure P13-19.