
Page 466 - Thomson, William Tyrrell-Theory of Vibration with Applications-Taylor _ Francis (2010)
P. 466
Chap. 13 Problems 453
13-7 Determine the mean and mean square values for the rectified sine wave.
13-8 Discuss why the probability distribution of the peak values of a random function
should follow the Rayleigh distribution or one similar in shape to it.
13-9 Show that for the Gaussian probability distribution p{x), the central moments are
given by
£(x") = r x^p(x)dx
—QO
0 for n odd
1 • 3 • 5 ’ • • (/t - l)o-" for n even
13-10 Derive the equations for the cumulative probability and the probability density
functions of the sine wave. Plot these results.
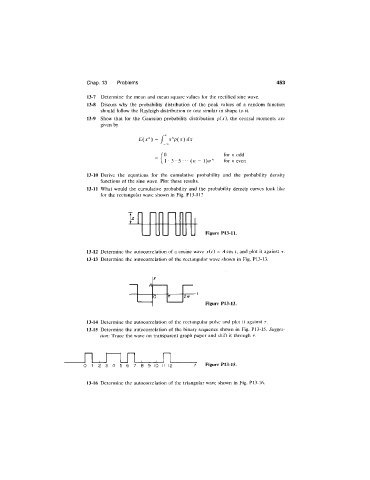
13-11 What would the cumulative probability and the probability density curves look like
for the rectangular wave shown in Fig. P13-11?
Ml
J Figure P13-11.
13-12 Determine the autocorrelation of a cosine wave x(t) = A cos t, and plot it against r.
13-13 Determine the autocorrelation of the rectangular wave shown in Fig. P13-13.
y
A
0 TT 2 n
Figure P13-13.
13-14 Determine the autocorrelation of the rectangular pulse and plot it against r.
13-15 Determine the autocorrelation of the binary sequence shown in Fig. P13-15. Sugges
.
tion’ Trace the wave on transparent graph paper and shift it through r.
0 1 2 3 4 5 6 7 8 9 10 II 12 t Figure P13-15.
13-16 Determine the autocorrelation of the triangular wave shown in Fig. P13-16.