
Page 257 - Bird R.B. Transport phenomena
P. 257
§8.3 Non-Newtonian Viscosity and the Generalized Newtonian Models 241
less, in many processes in the polymer industry, such as pipe flow with heat transfer, dis-
tributor design, extrusion, and injection molding, the non-Newtonian viscosity and its
enormous variation with shear rate are central to describing the flows of interest.
For incompressible Newtonian fluids the expression for the stress tensor is given by
Eq. 1.2-7 with the last term omitted:
+
т = -/*(Vv + (Vv) ) =-fiy (8.3-1)
in which we have introduced the symbol 7 = Vv + (Vv) , the rate-of-strain tensor (or rate-
+
of-deformation tensor). The generalized Newtonian fluid model is obtained by simply re-
placing the constant viscosity fi by the non-Newtonian viscosity 77, a function of the
shear rate, which in general can be written as the "magnitude of the rate-of-strain
tensor" у = У/\(у:у); it is understood that when the square root is taken, the sign must
be so chosen that у is a positive quantity. Then the generalized Newtonian fluid model is
+
т = -7y(Vv + (Vv) ) = -777 with 77 = 77(7) (8.3-2)
The components of the rate-of-strain tensor 7 can be obtained in Cartesian, cylindrical,
and spherical coordinates from the right sides of the equations in Table B.I by omitting
the (V • v) terms as well as the factor (-/л) in the remaining terms.
We now have to give an empiricism for the non-Newtonian viscosity function 77(7).
Dozens of such expressions have been proposed, but we mention only two here:
(a) The simplest empiricism for 77(7) is the two-parameter power law expression: 2
n
77 = my ~ l (8.3-3)
in which m and n are constants characterizing the fluid. This simple relation describes
the non-Newtonian viscosity curve over the linear portion of the log-log plot of the vis-
cosity versus shear rate for many materials (see, for example, the viscosity data in Fig.
8.2-4). The parameter m has units of Pa • s", and n - 1 is the slope of the log 77 vs. log у
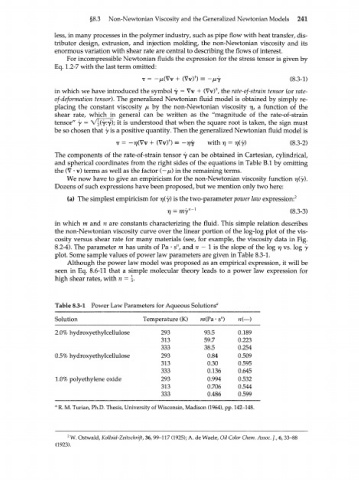
plot. Some sample values of power law parameters are given in Table 8.3-1.
Although the power law model was proposed as an empirical expression, it will be
seen in Eq. 8.6-11 that a simple molecular theory leads to a power law expression for
high shear rates, with n=\.
Table 8.3-1 Power Law Parameters for Aqueous Solutions' 7
Solution Temperature (K) m(Pa • s") n{—)
293 93.5 0.189
2.0% hydroxyethylcellulose 313 59.7 0.223
333 38.5 0.254
293 0.84 0.509
0.5% hydroxyethylcellulose 313 0.30 0.595
333 0.136 0.645
293 0.994 0.532
1.0% polyethylene oxide 313 0.706 0.544
333 0.486 0.599
a
R. M. Turian, Ph.D. Thesis, University of Wisconsin, Madison (1964), pp. 142-148.
W. Ostwald, Kolloid-Zeitschrift, 36, 99-117 (1925); A. de Waele, Oil Color Chem. Assoc. ]., 6, 33-88
2
(1923).