
Page 260 - Tribology in Machine Design
P. 260
Friction, lubrication and wear in higher kinematic pairs 245
where JJ.Q is the lubricant viscosity at the atmospheric pressure and the inlet
surface temperature, V = (Vi + K 2)/2 is the average surface velocity, [m/s],
5 is the lubricant viscosity-temperature coefficient, [ = (l/^)/A/VAT);
°C~ *] and p is the lubricant thermal conductivity.
The viscosity-temperature coefficient, 5, can be adequately estimated
from a temperature viscosity chart of the lubricant. It is necessary to select
two temperatures about 20° apart near the assumed inlet temperature and
divide the viscosity difference by the average viscosity and temperature
difference corresponding to the viscosity difference.
Thermal conductivity, p, is relatively constant for classes of lubricants
based on chemical composition. For mineral oils, suitable values for these
calculations are 0.12-0.15 W/mK. The lower range applies for lower
viscosity either resulting from lower molecular weight or higher tempera-
ture. To illustrate the procedure outlined above the numerical example
solved earlier is used. Thus, assuming that the lubricant is SAE10 mineral
1
oil, inlet temperature is 55 °C, corresponding 5 value is 0.045 °C~ and
lubricant thermal conductivity is 0.12W/mK, eqn (6.29) gives
Then, using eqn (6.28)
Finally, the thermally corrected film thickness is
This means a 20 per cent reduction of the film thickness as a result of the
heating at the inlet zone.
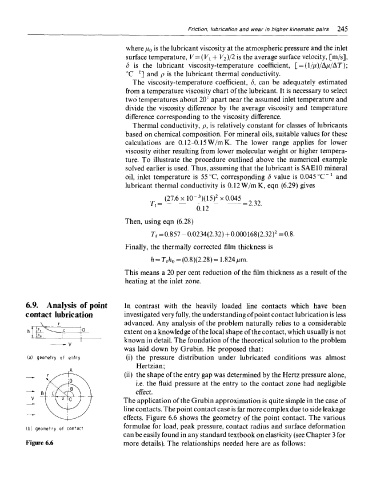
6.9. Analysis of point In contrast with the heavily loaded line contacts which have been
contact lubrication investigated very fully, the understanding of point contact lubrication is less
advanced. Any analysis of the problem naturally relies to a considerable
extent on a knowledge of the local shape of the contact, which usually is not
known in detail. The foundation of the theoretical solution to the problem
was laid down by Grubin. He proposed that:
(i) the pressure distribution under lubricated conditions was almost
Hertzian;
(ii) the shape of the entry gap was determined by the Hertz pressure alone,
i.e. the fluid pressure at the entry to the contact zone had negligible
effect.
The application of the Grubin approximation is quite simple in the case of
line contacts. The point contact case is far more complex due to side leakage
effects. Figure 6.6 shows the geometry of the point contact. The various
formulae for load, peak pressure, contact radius and surface deformation
can be easily found in any standard textbook on elasticity (see Chapter 3 for
more details). The relationships needed here are as follows: