
Page 74 - Tribology in Machine Design
P. 74
Basic principles of tribology 61
and
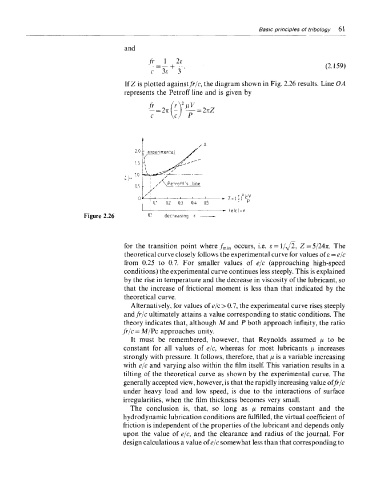
If Z is plotted against/r/c, the diagram shown in Fig. 2.26 results. Line OA
represents the Petroff line and is given by
Figure 2.26
for the transition point where/ min occurs, i.e. e = 1/^/2, Z — 5/24n. The
theoretical curve closely follows the experimental curve for values of s =e/c
from 0.25 to 0.7. For smaller values of e/c (approaching high-speed
conditions) the experimental curve continues less steeply. This is explained
by the rise in temperature and the decrease in viscosity of the lubricant, so
that the increase of frictional moment is less than that indicated by the
theoretical curve.
Alternatively, for values of e/c>Q.l, the experimental curve rises steeply
and/r/c ultimately attains a value corresponding to static conditions. The
theory indicates that, although M and P both approach infinity, the ratio
fr/c = M/Pc approaches unity.
It must be remembered, however, that Reynolds assumed ^ to be
constant for all values of e/c, whereas for most lubricants p increases
strongly with pressure. It follows, therefore, that fi is a variable increasing
with e/c and varying also within the film itself. This variation results in a
tilting of the theoretical curve as shown by the experimental curve. The
generally accepted view, however, is that the rapidly increasing value of fr/c
under heavy load and low speed, is due to the interactions of surface
irregularities, when the film thickness becomes very small.
The conclusion is, that, so long as /j. remains constant and the
hydrodynamic lubrication conditions are fulfilled, the virtual coefficient of
friction is independent of the properties of the lubricant and depends only
upon the value of e/c, and the clearance and radius of the journal. For
design calculations a value of e/c somewhat less than that corresponding to