
Page 100 - Tunable Lasers Handbook
P. 100
4 CO, Isotope Lasers and Their Applications 81
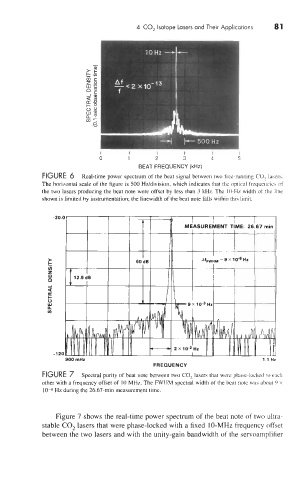
FIGURE 6 Real-time power spectrum of the beat signal between two free-running CO, lasers.
The horizontal scale of the figure is 500 Hz/division, which indicates that the optical frequencies of
the two lasers producing the beat note were offset by less than 3 kHz. The 10-Hz width of the line
shown is limited by instrumentation; the linewidth of the beat note falls within this limit.
-20.0 I
I
-1 20
900 mHz 1.1 H
FREQUENCY
FIGURE 7 Spectral purity of beat note between two CO, lasers that were phase-locked to each
other with a frequency offset of 10 MHz. The FWHM spectral width of the beat note was about 9 x
10-6 Hz during the 26.67-min measurement time.
Figure 7 shows the real-time power spectrum of the beat note of two ultra-
stable CO, lasers that were phase-locked with a fixed 10-MHz frequency offset
between the two lasers and with the unity-gain bandwidth of the servoamplifier