
Page 384 - Understanding Automotive Electronics
P. 384
2735 | CH 11 Page 371 Tuesday, March 10, 1998 1:30 PM
FUTURE AUTOMOTIVE ELECTRONIC SYSTEMS 11
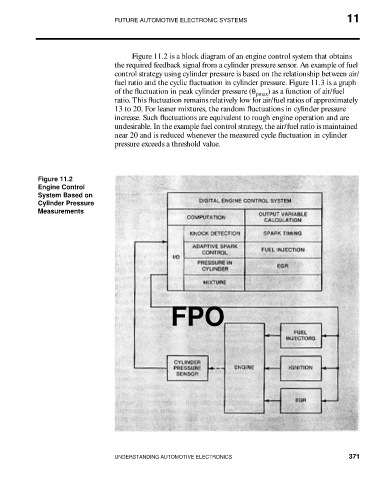
Figure 11.2 is a block diagram of an engine control system that obtains
the required feedback signal from a cylinder pressure sensor. An example of fuel
control strategy using cylinder pressure is based on the relationship between air/
fuel ratio and the cyclic fluctuation in cylinder pressure. Figure 11.3 is a graph
of the fluctuation in peak cylinder pressure (θ pmax ) as a function of air/fuel
ratio. This fluctuation remains relatively low for air/fuel ratios of approximately
13 to 20. For leaner mixtures, the random fluctuations in cylinder pressure
increase. Such fluctuations are equivalent to rough engine operation and are
undesirable. In the example fuel control strategy, the air/fuel ratio is maintained
near 20 and is reduced whenever the measured cycle fluctuation in cylinder
pressure exceeds a threshold value.
Figure 11.2
Engine Control
System Based on
Cylinder Pressure
Measurements
FPO
UNDERSTANDING AUTOMOTIVE ELECTRONICS 371