
Page 385 - Understanding Automotive Electronics
P. 385
2735 | CH 11 Page 372 Tuesday, March 10, 1998 1:30 PM
11 FUTURE AUTOMOTIVE ELECTRONIC SYSTEMS
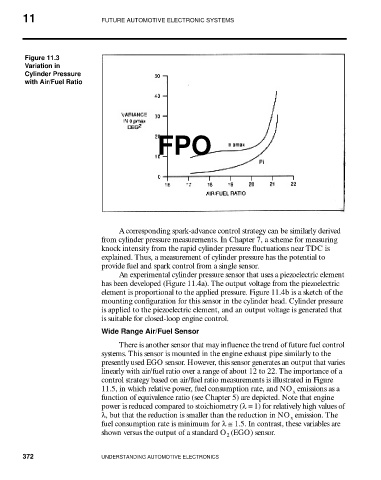
Figure 11.3
Variation in
Cylinder Pressure
with Air/Fuel Ratio
FPO
A corresponding spark-advance control strategy can be similarly derived
from cylinder pressure measurements. In Chapter 7, a scheme for measuring
knock intensity from the rapid cylinder pressure fluctuations near TDC is
explained. Thus, a measurement of cylinder pressure has the potential to
provide fuel and spark control from a single sensor.
An experimental cylinder pressure sensor that uses a piezoelectric element
has been developed (Figure 11.4a). The output voltage from the piezoelectric
element is proportional to the applied pressure. Figure 11.4b is a sketch of the
mounting configuration for this sensor in the cylinder head. Cylinder pressure
is applied to the piezoelectric element, and an output voltage is generated that
is suitable for closed-loop engine control.
Wide Range Air/Fuel Sensor
There is another sensor that may influence the trend of future fuel control
systems. This sensor is mounted in the engine exhaust pipe similarly to the
presently used EGO sensor. However, this sensor generates an output that varies
linearly with air/fuel ratio over a range of about 12 to 22. The importance of a
control strategy based on air/fuel ratio measurements is illustrated in Figure
11.5, in which relative power, fuel consumption rate, and NO emissions as a
x
function of equivalence ratio (see Chapter 5) are depicted. Note that engine
power is reduced compared to stoichiometry (λ = 1) for relatively high values of
λ, but that the reduction is smaller than the reduction in NO emission. The
x
fuel consumption rate is minimum for λ ≅ 1.5. In contrast, these variables are
shown versus the output of a standard O (EGO) sensor.
2
372 UNDERSTANDING AUTOMOTIVE ELECTRONICS