
Page 5 - Uninterruptible Power Supplies
P. 5
Standby Power Generating Sets
Standby Power Generating Sets 3
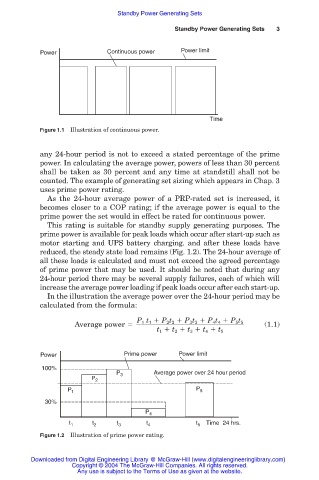
Power Continuous power Power limit
Time
Figure 1.1 Illustration of continuous power.
any 24-hour period is not to exceed a stated percentage of the prime
power. In calculating the average power, powers of less than 30 percent
shall be taken as 30 percent and any time at standstill shall not be
counted. The example of generating set sizing which appears in Chap. 3
uses prime power rating.
As the 24-hour average power of a PRP-rated set is increased, it
becomes closer to a COP rating; if the average power is equal to the
prime power the set would in effect be rated for continuous power.
This rating is suitable for standby supply generating purposes. The
prime power is available for peak loads which occur after start-up such as
motor starting and UPS battery charging. and after these loads have
reduced, the steady state load remains (Fig. 1.2). The 24-hour average of
all these loads is calculated and must not exceed the agreed percentage
of prime power that may be used. It should be noted that during any
24-hour period there may be several supply failures, each of which will
increase the average power loading if peak loads occur after each start-up.
In the illustration the average power over the 24-hour period may be
calculated from the formula:
P 1 t 1 P 2 t 2 P 3 t 3 P 4 t 4 P 5 t 5
Average power (1.1)
t 1 t 2 t 3 t 4 t 5
Power Prime power Power limit
100%
P 3 Average power over 24 hour period
P 2
P 1 P 5
30%
P 4
Time 24 hrs.
t 1 t 2 t 3 t 4 t 5
Figure 1.2 Illustration of prime power rating.
Downloaded from Digital Engineering Library @ McGraw-Hill (www.digitalengineeringlibrary.com)
Copyright © 2004 The McGraw-Hill Companies. All rights reserved.
Any use is subject to the Terms of Use as given at the website.