
Page 119 - Using ANSYS for Finite Element Analysis Dynamic, Probabilistic, Design and Heat Transfer Analysis
P. 119
106 • using ansys for finite eLement anaLysis
Input range after
Random output parameter Output range before Output range after Random output parameter Output range after Output range before
Input range
after
Input range before Input range
before
Random input variable Random input variable
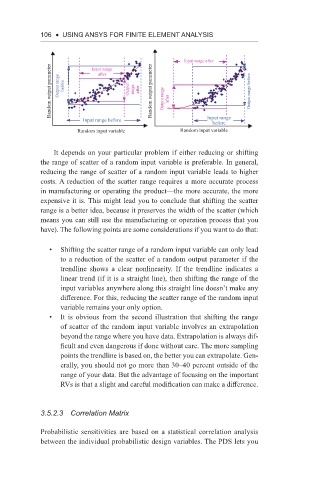
It depends on your particular problem if either reducing or shifting
the range of scatter of a random input variable is preferable. In general,
reducing the range of scatter of a random input variable leads to higher
costs. A reduction of the scatter range requires a more accurate process
in manufacturing or operating the product—the more accurate, the more
expensive it is. This might lead you to conclude that shifting the scatter
range is a better idea, because it preserves the width of the scatter (which
means you can still use the manufacturing or operation process that you
have). The following points are some considerations if you want to do that:
• Shifting the scatter range of a random input variable can only lead
to a reduction of the scatter of a random output parameter if the
trendline shows a clear nonlinearity. If the trendline indicates a
linear trend (if it is a straight line), then shifting the range of the
input variables anywhere along this straight line doesn’t make any
difference. For this, reducing the scatter range of the random input
variable remains your only option.
• It is obvious from the second illustration that shifting the range
of scatter of the random input variable involves an extrapolation
beyond the range where you have data. Extrapolation is always dif-
ficult and even dangerous if done without care. The more sampling
points the trendline is based on, the better you can extrapolate. Gen-
erally, you should not go more than 30–40 percent outside of the
range of your data. But the advantage of focusing on the important
RVs is that a slight and careful modification can make a difference.
3.5.2.3 Correlation Matrix
Probabilistic sensitivities are based on a statistical correlation analysis
between the individual probabilistic design variables. The PDS lets you