Page 90 - Using ANSYS for Finite Element Analysis Dynamic, Probabilistic, Design and Heat Transfer Analysis
P. 90

probabilistic Design analysis   •   77

                                                     [
                                            ()
                                        ∫ a b fx dx =  pr a ≤  X ≤  b]
                          For a discrete distribution, the pdf is the probability that the variate
                      takes the value x.

                                                    [
                                            fx () =  Pr X =  x]
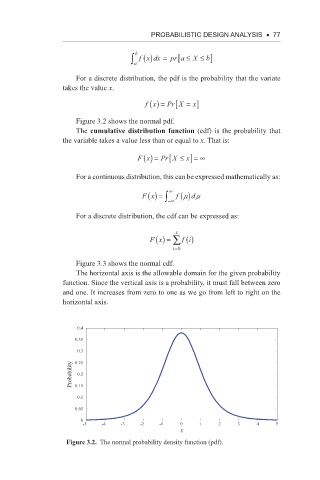
                          Figure 3.2 shows the normal pdf.
                          The cumulative distribution function (cdf) is the probability that
                      the variable takes a value less than or equal to x. That is:

                                                   [
                                          Fx () =  Pr X ≤  x] =∞

                          For a continuous distribution, this can be expressed mathematically as:
                                                   ∞
                                           Fx () = ∫ −∞ f () m  d m

                          For a discrete distribution, the cdf can be expressed as:

                                                     x
                                              Fx () = ∑ fi ()
                                                    i=0
                          Figure 3.3 shows the normal cdf.
                          The horizontal axis is the allowable domain for the given probability
                      function. Since the vertical axis is a probability, it must fall between zero
                      and one. It increases from zero to one as we go from left to right on the
                      horizontal axis.


                          0.4
                         0.35
                          0.3
                         0.25
                        Probability  0.15
                          0.2


                          0.1
                         0.05
                           0
                           -5    -4   -3   -2   -1    0    1    2    3    4     5
                                                      X
                       Figure 3.2.  The normal probability density function (pdf).
   85   86   87   88   89   90   91   92   93   94   95